Research Article: Journal of Drug and Alcohol Research (2021) Volume 10, Issue 10
Bio-Analytical Method Development and Validation for Simultaneous Quantification of Glecaprevir and Pibrentasvir in Rat Plasma by Using RP-HPLC
Prasanthi T* and Gowri Shankar DPrasanthi T, Department of Chest, TB Sri Ramachandra Medical College and Research Institute, India, Email: prasanthi8585@gmail.com
Received: 22-Nov-2021;Accepted Date: Dec 06, 2021; Published: 13-Dec-2021
Abstract
A novel bio-anlytical method was developed for the simultaneous determination of Glecaprevir and Pibrentasvir in rat plasma by using RP-HPLC method. The chromatographic separation was performed on Xterra RP18,(150 mm × 4.6 mm and 3.5 μm) column using the mobile phase ACN: 0.1% formic acid (50:50 v/v). The internal standard used was Voxilapre vir. Glecaprevir, Pibrentasvir and Voxilaprevir peaks were detected at 2.5min, 5.2 min and 6.3 min respectively. Linear response was obtained in the range of 0.15 μg/mL-2.25 μg/mL for Glecaprevir and 0.06 μg/mL-0.9μg/mL for Pibrentasvir. All of the parameters must be validated like selectivity, accuracy, precision, linearity, lower limit of quantification, matrix effect, and recovery reached the acceptance criteria under the following of US FDA guidelines
Keywords
Glecaprevir; Pibrentasvir; Voxilaprevir; Matrix effect; Recovery
Highlights
(RP-HPLC) Reverse PhaseHigh Performance Liquid Chromatography; (ACN) Acetonitrile; (C) Centigrade; (NS) Non Structural; (UV) Ultra Violet; (CV) Coefficent of Variation; (ISTD) Internal Standard; (LLOQ) Lower Limit of Quantitation; (LOQ) Limit of Quantitation; (HQC) High Quality Control; (MQC) Mid Quality Control; (LQC) Low Quality Control; (RS) Related Substances; (SD) Standard Deviation; (P and A) Precision and Accuracy.
Introduction
Infection with hepatitis C virus (HCV) genotype 3 is associated with higher rates of liver steatosis and achieving sustained virologic response quantifiably reverses its progression in those patients. GT3 has been shown to be an independent predictor of fibrosis progression and is associated with a higher incidence of hepatocellular carcinoma. Thus, effective HCV treatment options are critical for patients with HCV GT3 infection, particularly those with advanced liver disease and/or prior treatment experience.
Glecaprevir is an antiviral agent and Hepatitis C virus NS3/4A protease inhibitor which directly targets the the viral RNA replication (Figure 1). Glecaprevir is chemically known as(3aR,7S,10S,12R,21E,24aR)-7-tert -butyl-N-{(1R,2R)-2¬(difluoromethyl)-1-[(1-methylcyclopropane-1-sulfonyl) carbamoyl]cyclopropyl}-20,20-difluoro¬5,8-dioxo-2,3,3a,5,6,7,8 ,11,12,20,23,24a-dodecahydro-1H,10H-9,12methanocyclopenta[2-8]trioxadiazacyclononadecino[ 11,12-b]quinoxaline-10¬carboxamide hydrate. Glecaprevir disrupts the intracellular processes of the viral life cycle through inhibiting the NS3/4A protease activity of cleaving downstream junctions of HCV polypeptide and proteolytic processing of mature structural proteins [1-12].
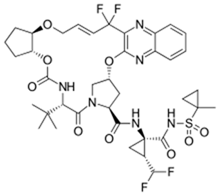
Figure 1: Structure of Glecaprevir.
Pibrentasvir is chemically dimethyl ((2S,2’S,3R,3’R)-((2S,2’S)- (((2R,5R)-1-(3,5-difluoro-4-(4-(4-fluorophenyl)piperidin-1-yl)phenyl) pyrrolidine-2,5-diyl)bis(6-fluoro-1H-benzo[d]imidazole-5,2-diyl)) bis(pyrrolidine-2,1-diyl))bis(3-methoxy-1-oxobutane-1,2-diyl))dicarbamate2 (Figure 2). It is a direct acting antiviral agent and Hepatitis C virus (HCV) NS5A inhibitor that targets the viral RNA replication and viron assembly. NS5A is a phosphoprotein that plays an essential role in replication, assembly and maturation of infectious viral proteins. The combination of Glecaprevir and Pibrentasvir seems to be effective option for treatment regardless of which genotype they have, and whether or not they have severe renal impairment or liver cirrhosis.
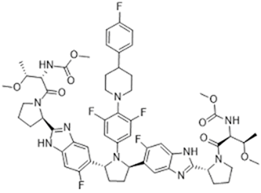
Figure 2: Structure of Pibrentasvir.
Literature survey revealed that HPLC3-12 methods were reported for simultaneous estimation of Glecaprevir and Pibrentasvir in pharmaceutical dosage forms but no method was developed for the estimation of these drugs in bio fluids by using RP-HPLC. In the present investigation, a specific RP-HPLC method was developed for simultaneous estimation of Glecaprevir and Pibrentasvir in rat plasma. This paper reports the novel, sensitive, rapid, precise and accurate method for the estimation of both Glecaprevir and Pibrentasvir in rat plasma by using HPLC
Materials and Methods
Pure Glecaprevir and Pibrentasvir samples were procured from Glenmark Pharmaceuticals, Mumbai. HPLC grade acetonitrile, formic acid and all other chemicals were obtained from Merck chemical division, Mumbai. HPLC grade water obtained from Milli-Q water purification system was used throughout the study.
Instrument
Chromatography was performed with Waters 2695 HPLC provided with high speed auto sampler, column oven, degasser and Waters 2998 PDA Detector to provide a compact and with class Empower-2 software.
Preparation of stock solutions
Buffer preparation: Transfer 1 mL formic acid into a 1000 mL volumetric flask and dilute to mark with water and mixed to preapare 0.1 M solution. The solution was filtered through 0.45 μ membrane filter paper.
Preparation of mobile phase
The mobile phase was composed of acetonitrile and 0.1% formic acid in the ratio 50:50 v/v and was used as diluent.
Preparation of glecaprevir and pibrentasvir stock solution
15 mg of Glecaprevir standard and 6 mg of Pibrentasvir standard was accurately weighed and transferred into a 100 mL volumetric flask and diluted to volume with mobile phase. Further dilute 1 mL of the above solution to 100 mL with diluent.
Preparation of internal standard stock solution
20 mg of Voxilaprevir standard was accurately weighed and transferred into a 100 mL volumetric flask and diluted to volume with diluent. Transfer 1 mL of the above solution to 100 mL volumetric flask and make upto volume with diluent.
Preparation of working standard solution
Transfer 5 mL of standard stock solution and 5 mL of ISTD stock solution into 50 mL volumetric flask and diluted to volume with diluent.
Preparation of linearity solution
Prepare the linearity solutions of concentration ranging from 0.06 μg/mL- 0.9 μg/mL of Pibrentasvir and 0.15 μg/mL-2.25 μg/mL of Glecaprevir from the above working standard solution. Add 250 μL rat plasma. Centrifuge at 4000 rpm for 15 min–20 min. Collect the supernatant solution in HPLC vial and inject into the chromatograph.
Preparation of spiked plasma sample
Blood samples were collected into blank tubes and centrifuged for 5 minutes at approximately 4000 rpm at 4°C. The plasma samples (supernatant) were separted and stored at -20°C until analysis was completed. Drugs were extracted from the plasma samples with the method of protein precipitation. Concisely 250 μL of plasma sample were extracted in 4 mL of extraction solvent (acetonitrile:0.1% formic acid, 50:50, v/v) including the internal standard (Voxilaprevir at 200 μg/mL ). The mixture was vortexed for 20 min and centrifuged at 4000 rpm, for 5 min at 4°C. After the centrifugation collect the supernatant layer and injected into chromatograph.
Results
Method development
The development of RP-HPLC method involves performing different trails using various proportions of mobile phases. Finally acetonitrile and 0.1% formic acid buffer in the ratio of 50:50, v/v was selected because it was found to be satisfied all peak parameters like theoretical plates, tailing factor, resolution etc. UV spectra of individual drugs were recorded at the wavelength range from 200 to 400 nm and the response for optimization was compared. The choice of wavelength 225 nm was considered satisfactory, permitting the detection of drugs with adequate sensitivity. Xterra RP18, (150 mm X 4.6 mm and 3.5 μm) column was optimised for better resolution of components. A suitable internal standard (ISTD) i.e. Voxilaprevir was used for controlling the variability in extraction recoveries. Preotein precipitation method was used for sample preparation. Flow rate was adjusted to 0.8 mL/min and the retention time for peaks of Glecaprevir, Pibrentasvir and Voxilaprevir was observed at 2.5 min, 5.2 min and 6.3 min respectively with a total run time of 10 minutes. The optimised chromatogram was depicted in Figure 3.
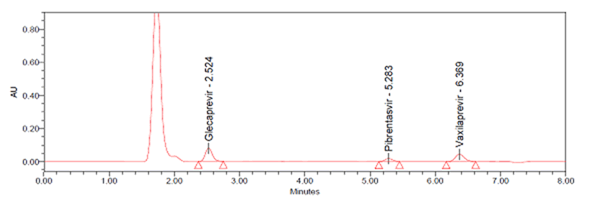
Figure 3: Optimized chromatogram.
Validation
The final developed method was validated by checking for linearity, precision, accuracy, matrix effect, and stability studies.
System suitability
System suitability parameter was validated by injecting six consecutive injections of MQC concentration of the calibration curve for all analytes and 1000 μg/mL for IS. The % CV of retention times for Glecaprevir and Pibrentasvir and ISTD area was found to be 0.16, 0.97 and 0.98%. Acceptance limit for retention time deviation and area deviation 2% and 5%CV respectively were passed. The results were given in Table 1.
Auto sampler carryover
Carry over can be tested by injecting a sequence of un-extracted samples consisting of RS, HQC, RS, LLOQ and extracted samples containing standard blank, HQC, standard blank, LLOQ. Negligible % recovery was observed and tabulated in Table 2
Specificity and screening of biological matrix
The specificity of HPLC method was established by screening the standards blanks of different lots of rat plasma. Six different lots of plasma were required and these were found to be free of significant interferences at the retention time of all analytes. Inorder to meet the acceptane criteria the % interference of drug standard in extracted LLOQ samples should be ≤ 20.00% and ≤ 5.00% of the area of the IS in the extracted LLOQ samples. The results were satisfied and summarized in Table 3.
Sensitivity
The sensitivity of the method was evaluated by analyzing 6 LLOQ at 1 μg/mL for Glecaprevir and Pibrentasvir respectively. The % CV was found to be 2.2 for Glecaprevir and 3.79 for Pibrentasvir and 96%-106% of nominal concentration which satisfied the acceptance criteria stated at least 67% of the sample should be within 80%-120% of nominal and precision should be <20 % CV. The results were represented in Table 4 Matrix effect.
Matrix effect can be evaluated by analyzing QC samples, each prepared using matrix from atleast 6 different sources. Precision (%CV) is 0.08% and 0.21% for Glecaprevir at HQC and LQC, respectively. Precision (%CV) is 1.88% and 4.96% for Pibrentasvir at HQC and LQC, respectively which satisfied the acceptance criteria i.e. the % CV should be less than 15%. The results were given in Table 5.
Linearity
Linearity curve was generated with the stanadard solutions in triplicate form which are showing linear response over the concentration range of 0.15 μg/mL-2.25 μg/mL of Glecaprevir and 0.06-0.9 μg/mL of Pibrentasvir. Samples were quantified using the ratio of peak area of analyte to that of ISTD. The response graph was plotted by peak area ratios Vs plasma concentrations. The correlation coefficient was found to be 0.999. The results were shown in Table 6 and linearity graph was represented in Figures 4 and 5.
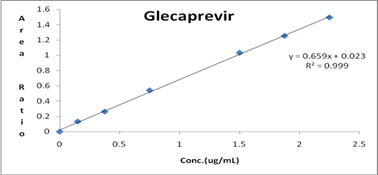
Figure 4: Calibration plot of Glecaprevir.
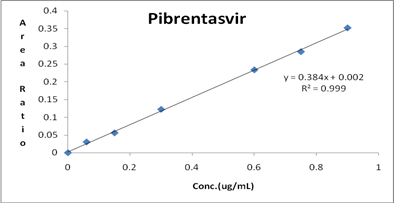
Figure 5: Calibration plot of Pibrentasvir
Precision and accuracy
The intra assay precision and accuracy was estimated by analyzing six replicates containing Glecaprevir and Pibrentasvir at four different QC levels. The inter assay precision was determined by analyzing the four levels QC samples on four different runs at each QC levels for Glecaprevir and Pibrentasvir were spiked combined with plasma sample and injected into HPLC. The percentage mean accuracy for all quality control samples with four replicates of three different batches for Glecaprevir and Pibrentasvir were within acceptance limits i.e 85%-115%. The results were tabulated in Tables 7 and 8
Recovery of analyte
The percentage mean recoveries were determined by measuring the responses of the quality control samples spiked into plasma against respective aqueous quality control samples at LQC, MQC and HQC levels. Three samples at each level were analyzed after extraction of each individual drug in separate solvent and % nominal concentration of the sample was calculated. Analyte recovery from a sample matrix (extraction efficiency) is a comparison of analytical response from an amount of analyte added to that determined from sample matrix.
Experiments with spiked compounds resulted in recoveries of analyte 85.1%-90.5% and for ISTD 84.25% which satisfied acceptance criteria. The recovery results were presented in Tables 9 and 10.
Ruggedness on precision and accuracy
Ruggedness was performed by different analysts using different columns and different instrument. The % CV for Glecaprevir and Pibrentasvir was found to be 1.22%-2.95% which meets acceptance criteria less than 15%.The results were tabulated in Tables 11 and 12
Ruggedness on reinjection reproducibility
Whole reinjection reproducibility was evaluated by reinjecting accepted Precision and Accuracy samples which were stored at 2°C-8°C for a period of 38 hours 32 minutes. The % mean accuracy for Glecaprevir was ranged from 97.2%-97.6% and for Pibrentasvir it was 97.4-97.8 which was within the limits 80%-120%. The results were presented in Tables 13 and 14.
Stability on day zero
The stability of the analytes in rat plasma was evaluated by analysis six replicates of quality control samples at low and high concentration levels at room temperature over 24 h(day zero). The measured concentrations were compared with that of freshly prepared and processed samples. The % CV and mean accuracy for Glecaprevir and Pibrentasvir were found to be 0.08% and 1.96%. The results were given in Table 15.
Long batch variation
The % CV and mean accuracy for Glecaprevir and Pibrentasvir were found to be 1.52%, 97.2%and 3.59%, 98.6% hence it passed the Long batch
Long term stability at -28°c
The stability of the analytes in rat plasma was evaluated by analysis six replicates of quality control samples at low and high concentration levels at -28°C temperature. Long term stability at -28°C stability was carried out by using six replicates of HQC and LQC level of samples. The long term stability of at -28°C±5°C was carried out by storing samples for 37 days. The results obtained are compared with those obtained by freshly prepared samples. The % CV and mean accuracy for Glecaprevir and Pibrentasvir were found to be 0.08%, 97.2% and 2.0%, 97.5% which is within the acceptance limit of 90.00 – 110.00%. The results are summarized in the Tables 16-18.
Long term stability at -80°C
Long term stability of the spiked quality control samples was determined after stored at -80°C for 14 days. Stability was assessed by comparing them against the freshly spiked calibration standards. The % CV and mean accuracy for Glecaprevir and Pibrentasvir were found to be 0.06%, 97.3% and 1.52%, 97.6%. Acceptance Criteria is at least 67% QC samples should pass acceptance limit of 85%-115% and more than 50% at each QC level should fail. Results were summarized.
Discussion
The goal of present method was to develop a novel, simple and accurate bio-analytical method for simultaneous quantitation of Glecaprevir and Pibrentasvir in rat plasma by RP-HPLC. Voxilaprevir was used as internal standard for this estimation. Samples were extracted from rat plasma by using method of protein precipitation. All the analytes and internal standard were seperated on Xterra RP18, (150 mm X 4.6 mm and 3.5 μm) column using the mobilephase ACN:0.1%formic acid (50:50). The peak responses of Glecaprevir, Pibrentasvir and Voxilaprevir were observed at 2.5 min, 5.2 min and 6.3 min respectively. Detection of analysis was performed at 225 nm. The method was validated for all the parameter such as system suitability specificity, sensitivity, linearity, accuracy, precision, recovery, matrix effect, dilution integrity, ruggedness and stability as per USFDA guidelines. The established method was found to be linear in the range of 0.15 μg/mL-2.25 μg/mL of Glecaprevir and 0.06 μg/mL-0.9 μg/mL of Pibrentasvir. The results of specificity demonstrated that there is no remarkable interference with the retention of analytes. % CV and accuracy values for all quality control samples were in between 0.11-3.05 for Glecaprevir and 2.17-6.26 for Pibrentasvir. The great extraction recovery for Glecaprevir at HQC, MQC, LQC was observed to be 93.78% and for Pibrentasvir it was 93.85% and 90.35% for internal standard. The stability of analytes was studied for HQC, LQC and MQC leves at zero hours, long batch LT at -28°C and LT at -80°C and the results were found to be greater than 95% which was within the acceptance criteria.
Conclusion
The current validated bio-analytical RP-HPLC method for simultaneous estimation of Glecaprevir and Pibrentasvir offers good accuracy and significant advantages in terms of sensitivity, selectivity and sample preparation. The single step protein precipitation, the short runtime of 10 min and isocratic elution makes the method economical and suitable for analysis of a large number of samples. The method is validated as per the requirements of US FDA guidelines. It can be concluded that the selected method was suitable for routine commercial and bioequivalence studies of Glecaprevir and Pibrentasvir samples.
Acknowledgements
Authors are thankful to University
Authors Contribution
The authors have read and approved the manuscript
References
- M. P. Koloski, H. Wang, D. Pugatch, E. Lawitz, Pharmacokinetics and safety of Glecaprevir and Pibrentasvir in HCV-negative subjects with hepatic impairment, Eur J Clin Pharmacol, 75 (2019), 217-26.
- F. J. Mensa, S. Lovell, T. P. Matias, Glecaprevir/Pibrentasvir for the treatment of chronic hepatitis C virus infection, Fut Micr , 14 (2019), 89-110.
- K. Hemalatha, C. Kistayya, N. D. Nizamuddhin, D. Dastiagiriamma, Simultaneous estimation of new analytical method development and validation of Glecaprevir and Pibrentasvir by High Performance Liquid Chromatography, Innovat Int J Med Pharma Sci, 3 (2018), 5-8.
- K. K. Rama, S. Raja, Simultaneous assay of two antiviral agents, Pibrentasvir and Glecaprevir, using stability indicating RP-HPLC method in bulk and tablets, Der Pharm Lettr, 10 (2018), 33-47.
- G. V. Kumar, D. Reddy, RP-HPLC method development and validation for simultaneous estimation of Glecaprevir and Pibrentasvir in pharmaceutical dosage form, Indo Amer J Pharma Sci, 5 (2018), 16827-40.
- N. D. V. R. Saradhi, R. Kumar, M. V. Reddy, A new technical method for Glecaprevir and Pibrentasvir in combined dosage forms using non polar HPLC. World J Pharma Med Res, 4 (2018), 173-8.
- V. Sreeram, C. H. Venkateswarlu, Stability indicating RP-HPLC method for the simultaneous estimation of Glecaprevir and Pibrentasvir in drug product, J Pharm Sci. Res, 10 (2018), 2757-61.
- D. C. Babu, C. M. Chetty, S. K. Mastanamma, A new force indicating RP-HPLC method development and validation for the simultaneous estimation of Pibrentasvir and Glecaprevir in bulk and its tablet dosage form, Pharm Methods, 9(2018), 79-86.
- M. Sridevia, C. G. Rao, T. S. Naidu, Development and validation for the simultaneous estimation of Glecaprevir and Pibrentasavir in drug product by UPLC. Euro J Biomed Pharmaceutical Sci, 5 (2018), 473-80.
- B. K. Sangameshwar, S. Sanjay, K. M. Thonte, Development of validated stability indicating RP-HPLC method for the estimation of Glecaprevir and Pibrentasvir in bulk and pharmaceutical dosage form, J App Pharma Sci, 9 (2019), 52-60.
- V. S. M. Satya, A. L. Rao, M. C. William, Stability-indicating high performance liquid chromatographic method for simultaneous assay of Pibrentasvir and Glecaprevir: Method development, validation and application to tablet dosage forms, J Res Pharma, 23 (2019), 153-9.
- N. Sunitha, S. Bhargav, C. M. Subash, B. Appa Rao, Method development and validation of Glecaprevir and Pibrentasvir in pure and pharmaceutical dosage forms by RP-HPLC method. Ind J Res in Pharm Biotech, 7 (2019), 67-83.

