

Research Article: Journal of Drug and Alcohol Research (2023) Volume 12, Issue 5
Design and Characterization of Dolutegravir Sodium Loaded Solid Lipid Nano Particles
Prasanth Y1*, S. Madhusudhan2, Shaik Harun Rasheed3 and P. Veera Lakshmi42Department of Pharmacy, Annamalai University, India
3Department of Pharmaceutics, Guru Nanak institutions Technical Campus, India
4Department of Pharmaceutical Sciences and Technologies, Jawaharlal Nehru Technological University, India
Prasanth Y, Research Scholar, Annamalai University, India, Email: yprasanth.mpharm@gmail.com
Received: 31-May-2023, Manuscript No. JDAR-23-103892; Editor assigned: 02-Jun-2023, Pre QC No. JDAR-23-103892 (PQ); Reviewed: 16-Jun-2023, QC No. JDAR-23-103892; Revised: 21-Jun-2023, Manuscript No. JDAR-23-103892 (R); Published: 28-Jun-2023, DOI: 10.4303/JDAR/236243
Abstract
Dolutegravir loaded SLN were prepared by using hot homogenization technique followed by ultra-sonication method. A 32 full factorial design has been employed to produce. The statistical optimization reduced the number of experiments that were carried out for obtaining formulations with desired properties. The derived polynomial equations, response and contour plots helped in predicting the values of selected independent variables for preparation of optimum SLN with desired properties. Solid lipid nanoparticles showed minimum particles size, optimum zeta potential and higher %EE. This experimental design revealed that Phospholipon 90H based formulation showed better result compared to Sphingomyelin, Soya Phosphatidyl Ethanolamine based formulations which could be due to maximum carbon chain length and high phase transition temperature. The drug excipients characterization parameters reveal that there is no drug-excipients interaction.
Keywords
Dolutegravir; SLN; Statistical optimization
Introduction
For decades, various pharmaceutical dosage forms such as tablets, capsules, liquids, suppositories, creams, ointments, injections, aerosols, etc. have been used as drug delivery systems for treatments of acute and chronic diseases. Colloidal drug delivery systems namely oil-in-water emulsions, liposomes, micelles, micro particles and nanoparticles opened a new frontier for targeting drugs and pharmaceuticals. Nanoparticles are solid colloidal particles in which the active principles are dissolved, entrapped, and or to which the active principle is adsorbed or attached [1- 5].
Nanoparticles offer several advantages in drug delivery owing to their small particle size, large surface area and the capability of changing their surface properties. In general, nanoparticles can be used to target the delivery of drugs, to sustain its effect, to improve bioavailability, to solubilize it for intravascular delivery and to improve its stability against enzymatic degradation.
Optimization using Response Surface Methodology (RSM) is a powerful, efficient and systematic tool that shortens the time required for the development of pharmaceutical dosage forms and improves research and development of work. RSM, where all the factors are studied in all possible combinations, are considered to be the most efficient in estimating the influence of individual variables and their interactions using minimum experiments. The application of RSM in pharmaceutical formulation development has played a key role in understanding the relationship between the independent variables and the responses to them. The independent variables are controllable, whereas responses are dependent.
Hence, in the present investigation Dolutegravir was selected as the drug of choice as it was having the required characteristics for the design of the SLNs. There were very few reports on the use of statistical approach in the development and optimization of SLNs hence the statistical approach like full factorial design was utilized to obtain optimized formulation with less number of experiments [6-10].
Materials
Dolutegravir was obtained gift sample from Glenmark Pharmaeuticals, Sphingomyelin, Soya Phosphatidyl Ethanolamine, Phospholipon 90H, Tween 20, Span 20, PEG 200, PEG 400, Propylene glycol were obtained gift sample from Merck, Capmul MCM, Captex 200, Abitec Group, Labrafac LipophileWL1349, Labrasol, Labrafil gift sample from Gattefosse, France.
Methods
Appearance and melting point
The organoleptic characteristics like colour, odour and texture were observed by sensory organs. The melting point was determined using capillary fusion method where a small amount of drug was filled in a capillary sealed from one side and kept inverted. The temperature at which drug started liquefy was recorded and compared with literature value and shown in Table 1.
Table 1: Formulation codes in 32 factorial designs
| Levels | ||
|---|---|---|
| Formulation | Poloxamer 407 (mg) | Cremophor EL (mg) |
| F1 (-1,-1) | 100 | 100 |
| F2 (-1,0) | 100 | 150 |
| F3 (-1,+1) | 100 | 200 |
| F4 (0,-1) | 150 | 100 |
| F5 (0,0) | 150 | 150 |
| F6 (0,+1) | 150 | 200 |
| F7 (+1,-1) | 200 | 100 |
| F8 (+1,0) | 200 | 150 |
| F9 (+1,+1) | 200 | 200 |
Determination of absorption maxima (λmax) of Dolutegravir using UV spectrophotometer
1000 μg/ml of stock solution of Dolutegravir was prepared by dissolving 50 mg of drug in 50 ml of Dimethyl formamide and diluting 1 ml of above solution to 10 ml with ethanol. The 10 μg/ml of drug concentrations were then prepared and scanned using UV spectrophotometer to determine the λmax of drug. Observed λmax of Dolutegravir was at 259 nm.
Solubility study of the drug
The solubility study of Dolutegravir was carried out in various solvents. Accurately weighed 20 mg of drug was added to screw capped vials containing 10 ml of solvent. The vials were kept in a water bath shaker at 37°C ± 0.5°C and shaken for 24 h. The mixtures were then filtered through millipore filter membrane of pore size 0.45 μm, diluted and drug was analyzed using UV spectrometer.
Preparation of calibration curve of Dolutegravir using UV-spectrophotometric method
The calibration curve of Dolutegravir was prepared using phosphate buffer pH 6.8. Accurately weighed 50 mg of drug was dissolved in 50 ml ethanol to obtain concentration of 1 mg/ml. The 1 ml of prepared solution was further diluted 10 times to obtain stock solution of 100 μg/ml. From the secondary stock solution 2.5 ml, 2 ml, 1.5 ml, 1 ml and 0.5 ml were taken separately and diluted to 10 ml separately with pH 6.8 buffer to get 25 μg/ml, 20 μg/ml, 15 μg/ml, 10 μg/ml and 5 μg/ml concentrations respectively.
Selection of oils, surfactants and cosurfactants
The lipids, surfactants and co-surfactants were selected based on solubility of the drug. The study was carried out by taking 2 ml of selected lipid (Corn oil, Olive oil, Soyabean Oil, Peanut oil, Sesame oil, Labrafac Lipophilewl1349, Capmul MCM, Ethyl oleate, Sphingomyelin, Soya Phosphatidyl Ethanolamine and Phospholipon 90H)/surfactant (Span 80, Tween 80, Tween 20, Span 20, Labrasol, Cremophor EL, Labrafil)/cosurfactant (Poloxamer 407, PEG 200, PEG 400, Propylene Glycol) in glass vial containing excess amount of drug. The mixtures were mixed manually for 30 minutes in order to facilitate proper mixing of drug with the vehicles. The vials were sonicated for 2 h and kept in water bath for 48 h for equilibriation. The vials were centrifuged at 3000 rpm for 20 minutes, followed by filtration. The filtrate was suitably diluted with ethanol and drug dissolved in various vehicles was analysed by UV spectrophotometer at 259 nm [11-13].
Preparation of solid lipid nanoparticles
Dolutegravir loaded SLN were prepared with 3 different Phospholipids namely Sphingomyelin, Soya Phosphatidyl Ethanolamine and Phospholipon 90H by hot homogenization technique followed by ultrasonication method. These 3 were selected since they had better solubility when compared to other lipids.
Dolutegravir, Phospholipids and Cremophor EL were heated above the melting temperature of lipid around 56°C-68°C and mixed rapidly with glass rod in hot molten condition. Poloxamer 407 dissolved in water heated to equal temperature and was added to the molten lipid phase and homogenization was carried out. Hot homogenization was carried out for 3 minutes at 5000 rpm in order to get coarse emulsion. Finally the obtained pre-emulsion was subjected to ultrasonication.
Optimization of ultrasonication time
Ultrasonication was carried out with the help of ultrasonic homogenizer. Ultrasonication was carried out for different time intervals 5 minutes, 10 minutes, 15 minutes, 20 minutes and 25 minutes. With the help of Zetasizer NanoZS average particle size of obtained SLN was measured [14].
Factorial design
A 32 randomized full factorial design was used in this study and 2 factors were evaluated, each at 3 levels, experimental trials were performed at all 9 possible combinations. Amount of Poloxamer 407 (X1) and Cremophor EL (X2) were selected as 2 independent variables which were varied at 3 levels, low level (-1), medium level (0), high level (+1).
Amount of drug simvastatin (50 mg), Phospholipds (400 mg) concentrations and dispersion medium water 20 ml were kept constant. Particle size (Y1), zeta potential (Y2) and entrapment efficiency (Y3) were selected as dependent variables. Values of variables and formulation codes are shown in the Tables 1 and 2. Design-Expert® 12 software trial version was used for the generation and evaluation of statistical experimental design.
Table 2: Variables in 32 factorial designs
| Independent variable | Low (mg) | Medium (mg) | High (mg) |
|---|---|---|---|
| X1: Poloxamer 407 | 100 | 150 | 200 |
| X2: Cremophor EL | 100 | 150 | 200 |
| Dependent variable | - | - | - |
| Y1 Particle size (nm) | - | - | - |
| Y2 Zeta Potential (Mv) | - | - | - |
| Y3 Entrapment Efficiency (%) | - | - | - |
Optimization of surfactant and co-surfactant
The optimization of surfactant and co-surfactant was done by using 32 factorial designs. Poloxamer 407 was chosen as independent factor (X1) and taken at 3 different concentrations 100 mg, 150 mg and 200 mg. Cremophor EL was selected as independent factor (X2) and taken at 3 different concentrations 100 mg, 150 mg and 200 mg. amount of drug 50 mg, Phospholipids 400 mg and the final volume of SLN 20 ml was kept constant. The particle size (Y1) zeta potential (Y2) and % entrapment efficiency (Y3) were selected as 3 dependent factors as shown in Table 3.
Table 3: Compositions of Dolutagravir loaded SLN
| Compositions | ||
|---|---|---|
| F6 (0,+1) | 150 | 200 |
| F7 (+1,-1) | 200 | 100 |
| F8 (+1,0) | 200 | 150 |
| F9 (+1,+1) | 200 | 200 |
Determination of particle size distribution, Polydispersity Index (PDI), and zeta potential of SLN
The particle size distribution, polydispersity index, and zeta potential of Dolutagravir loaded SLN were measured using a Malvern Zetasizer. About 100 μL of the prepared SLN dispersion was diluted to 5 mL with double distilled water and analyzed with Zetasizer. Photon correlation spectroscopy is the most widely used technique for measurement of particle size and zeta potential. The principle of dynamic light scattering at a scattering angle of 90° is used to measure particle size.
Determination of percentage entrapment efficiency (%EE)
The percentage of drug entrapped in the lipid is determined by measuring the concentration of the drug in the aqueous phase by ultrafiltration method using centrisart devices. Centrisart consist of filter membrane (Molecular weight cut off 20,000 daltons) at the base of sample recovery chamber. About 1 ml of undiluted sample is placed in the outer chamber on the top of the sample holder. The unit is centrifuged at 3,500 rpm for 15 minutes-20 minutes. The solid lipid nanoparticles along with the encapsulated drug remain in the outer chamber and the aqueous phase is moved into the sample recovery chamber through membrane.
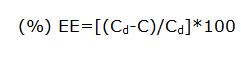
Where, Cd is the concentration of total drug and C is the concentration of unentrapped drug.
Statistical analysis of the data and optimization
Response surface modelling and evaluation of the quality of fit of the model for the current study were performed employing Design Expert® 12 software trial version. Polynomial models including linear, interaction and quadratic terms were generated for all the response variables using Multiple Linear Regression Analysis (MLRA).
A second order polynomial equation that describes the effect of independent factors on the response is expressed in the following forms:
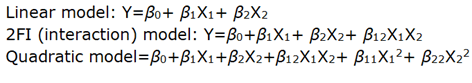
Where, Y is the dependent variable, β0 is the arithmetic mean response of the 9 runs, and β1 and β2 are the estimated coefficients for the factors X1 and X2 respectively. The main effect (X1 and X2) represents the average result of changing one factor at a time from its low to high value. The interaction term (X1X2) shows how the response changes when 2 factors were changed simultaneously. The polynomial terms (X1X1, X2X2) are included to investigate nonlinearity. The equation enables the study of the effects of each factor and their interaction over the considered responses.
The polynomial equation was used to draw conclusions after considering the magnitude of coefficients and the mathematical sign it carries, positive or negative. A positive sign signifies a synergistic effect, whereas a negative sign stands for an antagonistic effect. The best fitting mathematical model was selected based on the comparisons of statistical parameters which include the Coefficient of Variation (CV), the coefficient of determination (R2), adjusted coefficient of determination (adjusted R2) and the Predicted Residual Sum of Square (PRESS), provided by Design Expert software. Among them, PRESS indicates how well the model fits the data and for the chosen model it should be small relative to the other models under consideration. Level of significance was considered at p<0.05. Mathematical relationships in the form of polynomial equations are generated using Multiple Linear Regression Analysis (MLRA) and used to find out the relative influence of each factor on the response.
Analysis Of Variance (ANOVA) for the responses was performed to identify significant effect of factors on responses and the model parameters were obtained. The relationship between the dependent and independent variables was further elucidated using contour and response surface plots. These plots are very useful to study of the effects of 2 factors on the response at one time and predict the responses of dependent variables at the intermediate levels of independent variables. Subsequently, a numerical optimization technique by the desirability and graphical optimization technique by the overlay plot approach were used to generate the new formulation with the desired responses. An optimized formulation was developed by setting constraints (goals) on the dependent and independent variables.
Compatibility study
Interaction between the drug, oil, surfactant and cosurfactant were studied by FT-IR. The blank KBr pellets were prepared, onto which oil, surfactant and cosurfactant were dropped individually and it was pressed with another blank KBr pellet using hydraulic press. The pure drug was mixed with KBr in the ratio of 1:3 and punched in a hydraulic press at 5 ton-6 ton load. The prepared pellets were scanned from 4000 cm-1 to 400 cm-1 using FT-IR spectrophotometer (FT-IR 8400 S, Shimadzu). The FT-IR spectra of the physical mixture were compared with the spectra of pure drug, phospholipid, surfactant and cosurfactant.
Differential Scanning Calorimetry (DSC): DSC was performed using a Differential scanning calorimeter (DSC 220C, Seiko, Japan) at a heating rate of 100°C/min from 30°C to 3000°C in nitrogen atmosphere.
In vitro drug release studies from SLN
The in vitro release studies of Dolutagravir loaded solid lipid nanoparticles were carried out by using modified Franz diffusion cell. Dialysis membrane having pore size 2.4 nm with molecular weight cut off 10,000 daltons was used. Membrane was soaked in double distilled water for 12 hours before mounting in Franz diffusion cell. Dolutagravir loaded 2 mL of SLN dispersion equivalent to 4 mg was applied to the donor compartment. And the receptor compartment was filled with 12 ml of dialysis medium of 6.8 phosphate buffer. Samples (100 μL) were withdrawn from receiver compartment through side tube at regular time intervals and the same was replaced with fresh dialysis medium maintained at same temperature. In the similar way pure drug equivalent to 4 mg was also added to the 2 ml of distilled water and release studies were performed for comparison.
Release kinetics
The analysis of drug release kinetics and mechanism from a pharmaceutical dosage form is an important but complicated process.
The order of drug release from SLNs was described by using zero order or first order kinetics. The mechanism of drug release was studied by using Higuchi diffusion model and Hixon-Crowell erosion model. Korsemeyer-Peppas support the drug release mechanism for further judgment. The respective equations for these models are shown in below Table 4. According to Korsmeyer-Peppas equation, the release exponent ‘n’ value is used to characterize different release mechanisms for a dosage form with cylindrical shape and summarized in Table 5.
Table 4: Appearance and melting point
| Drug | Parameter | Reported | Observed |
|---|---|---|---|
| Dolutegravir | Appearance | White to light yellowish white | White to light yellowish white |
| Odour | None | None | |
| Melting point | 190-1930c | 1920c |
Table 5: Solubility of drug in various solvents
| Solvent | Dolutegravir |
|---|---|
| Solubility (μg/ml) | |
| Distilled water | 2.69 ± 2.3 |
| 0.1 N HCl | 32.5 ± 0.33 |
| Phosphate buffer pH 6.8 | 550.87 ± 10.4 |
| Ethanol | 1879.38 ± 32.6 |
| Methanol | 1250.4 ± 9.4 |
Results and Discussion
Appearance and melting point
From the above data it was observed that the appeared and observed results were same.
Solubility of drug in various solvents
It was found from the above solubility studies that Dolutegravir has highest solubility in Ethanol.
Determination of λmax
From the above, it was found that λmax of Dolutegravir at 259 nm (Figure 1). Standard plot that was plotted helps in understanding the wavelength at which drug absorbs. The Table 6 details the relationship between concentration and absorbance at 259 nm. Figure 2 explains the standard plot of Dolutegravir in pH 6.8 buffer and Table 7 shows the Statistical parameters for standard curves of Dolutegravir in pH 6.8 buffer.
Table 6: Calibration curve of Dolutegravir in pH6.8 buffer
| Concentration (μg/ml) | Absorbance (nm) |
|---|---|
| 0 | 0 |
| 5 | 0.196 ± 0.21 |
| 10 | 0.401 ± 0.96 |
| 15 | 0.603 ± 0.43 |
| 20 | 0.801 ± 0.55 |
| 25 | 0.999 ± 0.37 |
| Data is expressed as mean ± SD (n=3)
|
|
Table 7: Statistical parameters for standard curves of Dolutegravir in pH 6.8 buffer
| S. No | Parameter | pH 6.8 buffer |
|---|---|---|
| 1. | λmax (nm) | 259 |
| 2. | Linearity range (μg/ml) | 0-25 |
| 3. | Regression equation | y=0.0406 × -0.0023 |
| 4. | Intercept | 0.0023 |
| 5. | Slope | 0.0406 |
| 6. | Correlation coefficient (R2) | 0.999 |
Optimization of ultrasonication time on particle size
Average particle size of Sphingomyelin, Soya Phosphatidyl Ethanolamine and Phospholipon 90H based SLN were prepared with ultrasonication time of 5 minutes, 10 minutes, 15 minutes, 20 minutes and 25 minutes and are shown in Table 8 and Figure 3. The particle size was affected by the sonication time. As the sonication time increased the particle size was decreased up to 20 minutes and further decrease in particle size was not observed at 25 minutes.
Table 8: Effect of sonication time on particle size (nm) (n=3)
| Sonication time (min) | Sphingomyelin SLN |
Soya Phosphatidyl Ethanolamine SLN | Phospholipon 90H SLN | |||
|---|---|---|---|---|---|---|
| Size (nm) | PDI | Size (nm) | PDI | Size (nm) | PDI | |
| 5 | 178 ± 0.6 | 0.381 ± 0.1 | 193 ± 2.1 | 0.212 ± 0.2 | 159 ± 0.3 | 0.341 ± 0.7 |
| 10 | 133 ± 1.6 | 0.316 ± 0.1 | 127 ± 0.9 | 0.198 ± 0.5 | 131 ± 1.9 | 0.276 ± 0.8 |
| 15 | 102 ± 1.3 | 0.296 ± 0.3 | 107 ± 1.5 | 0.229 ± 0.8 | 103 ± 0.7 | 0.182 ± 0.2 |
| 20 | 99 ± 0.9 | 0.424 ± 0.2 | 98 ± 0.3 | 0.139 ± 0.4 | 95 ± 0.2 | 0.441 ± 0.4 |
| 25 | 98 ± 1.0 | 0.464 ± 0.4 | 98 ± 1.3 | 0.275 ± 0.6 | 96 ± 0.3 | 0.217 ± 0.1 |

Figure 1: UV Spectra of Dolutegravir at 259 nm

Figure 2: Standard plot of Dolutegravir in pH 6.8 buffer

Figure 3: Relationship between Sonication time (min) Vs Particle Size (nm)
Percent drug content (%)
The percentage drug content of the SLN formulations varied between 94.70% ± 0.2% to 101.7% ± 0.2% respectively as shown in Tables 9-11. Hence all the formulations were within the standard limits (90% to 110%). This indicated uniform distribution of drug in each SLN formulation and there was no wastage of the drug during preparation of SLN.
Table 9: Characterization of SLN prepared with Sphingomyelin
| Batch | % Drug content | Size (nm) | Zeta potential (mV) | PDI | %EE |
|---|---|---|---|---|---|
| SNF1 | 99.1 ± 0.1 | 157.8 ± 0.7 | -25.1 ± 0.1 | 0.227 ± 0.6 | 58.3 ± 1.2 |
| SNF2 | 96.0 ± 0.1 | 110.8 ± 1.8 | -22.9 ± 0.6 | 0.175 ± 0.2 | 48.6 ± 1.7 |
| SNF3 | 101.7 ± 0.2 | 125.6 ± 1.2 | -45.1 ± 4.1 | 0.254 ± 0.1 | 76.1 ± 1.1 |
| SNF4 | 99.2 ± 0.1 | 210.6 ± 1.7 | -38.3 ± 0.3 | 0.287 ± 0.2 | 53.2 ± 0.4 |
| SNF5 | 100.0 ± 0.2 | 101.7 ± 1.3 | -31.3 ± 0.1 | 0.201 ± 0.1 | 74.4 ± 0.9 |
| SNF6 | 98.2 ± 0.0 | 102.7 ± 1.0 | -35.3 ± 1.2 | 0.445 ± 0.5 | 79.1 ± 1.2 |
| SNF7 | 100.2 ± 0.1 | 104.2 ± 1.0 | -37.7 ± 0.4
|
0.222 ± 0.0 | 65.6 ± 0.8 |
| SNF8 | 99.1 ± 0.0 | 108.8 ± 0.2 | -36.7 ± 1.8 | 0.210 ± 0.2 | 54.2 ± 0.3 |
| SNF9 | 101.0 ± 0.0 | 98.9 ± 0.6 | -31.6 ± 1.1 | 0.212 ± 0.1 | 95.1 ± 0.1 |
Table 10: Characterization of SLN prepared with Soya Phosphatidyl Ethanolamine
| Batch | % Drug content | Size (nm) | Zeta potential (mV) | PDI | % EE |
|---|---|---|---|---|---|
| SPF1 | 100.7 ± 0.1 | 213.5 ± 0.1 | -18.3 ± 1.1 | 0.180 ± 0.2 | 53.3 ± 1.0 |
| SPF2 | 98.2 ± 0.1 | 133.9 ± 0.1 | -23.9 ± 0.7 | 0.327 ± 0.2 | 51.2 ± 1.0 |
| SPF3 | 99.0 ± 0.1 | 105.3 ± 0.2 | -34.2 ± 3.2 | 0.337 ± 0.1 | 71.4 ± 1.2 |
| SPF4 | 98.2 ± 0.2 | 165.1 ± 0.2 | -26.5 ± 1.2 | 0.262 ± 0.0 | 55.2 ± 1.0 |
| SPF5 | 101.0 ± 0.2 | 113.3 ± 0.1 | -19.3 ± 0.1 | 0.242 ± 0.1 | 69.3 ± 1.0 |
| SPF6 | 98.2 ± 0.2 | 103.9 ± 0.1 | -23.1 ± 0.2 | 0.310 ± 0.4 | 75.6 ± 1.0 |
| SPF7 | 94.7 ± 0.2 | 139.9 ± 0.2 | -48.7 ± 0.4 | 0.377 ± 0.2 | 61.2 ± 0.1 |
| SPF8 | 100.3 ± 0.2 | 116.6 ± 0.2 | -45.5 ± 1.2 | 0.269 ± 0.6 | 52.3 ± 0.2 |
| SPF9 | 100.7 ± 0.1 | 93.1 ± 0.2 | -30.6 ± 1.2 | 0.180 ± 0.2 | 95.4 ± 1.1 |
Table 11: Characterization of SLN prepared with Phospholipon 90H
| Batch | % Drug content | Size (nm) | Zeta potential (mV) | PDI | % EE |
|---|---|---|---|---|---|
| SHF1 | 98.0 ± 0.1 | 194.7 ± 0.2 | -23.3 ± 0.3 | 0.321 ± 0.2 | 62.5 ± 1.2 |
| SHF2 | 99.0 ± 0.2 | 208.7 ± 0.2 | -20.4 ± 0.5 | 0.361 ± 0.2 | 54.9 ± 0.1 |
| SHF3 | 100.7 ± 0.2 | 214.6 ± 0.2 | -44.9 ± 3.2 | 0.274 ± 0.1 | 80.1 ± 1.2 |
| SHF4 | 99.2 ± 0.1 | 137.4 ± 0.1 | -24.4 ± 0.4 | 0.282 ± 0.2 | 56.3 ± 0.1 |
| SHF5 | 100.1 ± 0.9 | 214.5 ± 0.1 | -39.4 ± 1.1 | 0.307 ± 0.1 | 78.3 ± 1.1 |
| SHF6 | 100.1 ± 0.1 | 171.5 ± 0.1 | -35.4 ± 0.2 | 0.324 ± 0.1 | 82.5 ± 2.3 |
| SHF7 | 97.1 ± 0.2 | 165.3 ± 0.1 | -36.8 ± 1.9 | 0.198 ± 0.2 | 67.2 ± 0.2 |
| SHF8 | 98.1 ± 0.1 | 131.8 ± 0.2 | -38.6 ± 2.4 | 0.301 ± 0.3 | 58.3 ± 0.1 |
| SHF9 | 99.0 ± 0.2 | 96.4 ± 0.2 | -30.5 ± 1.1 | 0.277 ± 0.2 | 97.4 ± 2.0 |
Particle size distribution (nm), zeta potential (mV) and Polydispersity Index (PDI)
The mean particle size was in the range of 98.9 nm ± 0.6 nm to 210.6 nm ± 1.7 nm, 93.1 nm ± 0.2 nm to 213.5 nm ± 0.1 nm and 96.4 nm ± 0.2 nm to 214.5 nm ± 0.1 nm for Sphingomyelin, Soya Phosphatidyl Ethanolamine and Phospholipon 90H based formulations respectively as shown in Figure 4 after 20 minutes time of ultrasonication time. The Polydispersity Index (PDI) was in the range of 0.175 ± 0.2 to 0.445 ± 0.5. Zeta potential values of SLN ranged from -22.9 mV ± 0.6 mV to -45.1 mV ± 4.1 mV, -18.3 mV ± 1.1 mV to -48.7 mV ± 0.4 mV, -20.4 mV ± 0.5 mV to -44.9 mV ± 3.2 mV for Sphingomyelin, Soya Phosphatidyl Ethanolamine and Phospholipon 90H based formulations respectively. The zeta potential value was found to be > ± 30 mV for almost all the formulations prepared. For any liquid dosage form surface charge is essential for its stability. Zeta potential value > ± 30 mV is essential for effective stability and to inhibit aggregation of particles. As the poloxamer 407 concentration increased particle size was decreased. In 3 formulations optimum size was obtained at 200 mg of poloxamer 407 concentrations. The low polydispersity index in all the formulations indicated the homogeneity of the particle size. The formulations showed negative zetapotential since solid lipid nanoparticles have negative charge on their surface.

Figure 4: Comparison of particle size of SLNs prepared by different Phospholipids
Determination of percent Entrapment Efficiency (%EE)
The percent entrapment efficiency of SLN was determined after separating entrapped and entrapped drug by ultra-filtration. The percent entrapment efficiency varied from 48.6% to 97.4% for all the formulations as shown in Figure 5. Highest entrapment efficiency of 97.4% was observed for Phospholipon 90H based SLN. The lowest entrapment effeciency was observed when the independent variables poloxamer 407 (X1) and Cremophor EL (X2) were at 100 mg and 150 mg concentartions for all the SLN formulations prepared with 3 different phospholipids.

Figure 5: Comparative % EE of SLN formulations
The highest entrapment effeciency was observed when the independent variables poloxamer 407 (X1) and Cremophor EL (X2) were at higher level (200 mg) concentrations for all the SLN formulations prepared with 3 different phospholipids. There is no difference in entrapment efficiency, among 3 phospholipids. This could be due to maximum carbon chain length in the 3 phospholipids.
Statistical analysis of the data and optimization
In the current study 3 Phospholipids namely Sphingomyelin, Soya Phosphatidyl Ethanolamine and Phospholipon 90H were selected for the preparation of SLN using fixed concentration of 400 mg. From the preliminary study, it was found that poloxamer 407 and Cremophor EL has strong effect on physico-chemical properties of solid lipid nanoparticles such as particle size, entrapment efficiency, stability and in vitro behavior. Amount of poloxamer 407 (X1) and amount of Cremophor EL (X2) were selected as independent factors for preparation of solid lipid nanoparticles respectively. Particle size, zetapotential and % entrapment efficiency were considered as the 3 dependent factors the observed responses were shown in Tables 12- 14 respectively.
Table 12: Observed responses of Dolutegravir loaded Sphingomyelin based SLN
| Batch | Poloxamer 407 | Cremophor EL | Size (nm) | Zeta potential (mV) | % EE |
|---|---|---|---|---|---|
| SNF1 | -1 | -1 | 157.8 ± 0.7 | -25.1 ± 0.1 | 58.3 ± 1.2 |
| SNF2 | -1 | 0 | 110.8 ± 1.8 | -22.9 ± 0.6 | 48.6 ± 1.7 |
| SNF3 | -1 | 1 | 125.6 ± 1.2 | -45.1 ± 4.1 | 76.1 ± 1.1 |
| SNF4 | 0 | -1 | 210.6 ± 1.7 | -38.3 ± 0.3 | 53.2 ± 0.4 |
| SNF5 | 0 | 0 | 101.7 ± 1.3 | -31.3 ± 0.1 | 74.4 ± 0.9 |
| SNF6 | 0 | 1 | 102.7 ± 1.0 | -35.3 ± 1.2 | 79.1 ± 1.2 |
| SNF7 | 1 | -1 | 104.2 ± 1.0 | -37.7 ± 0.4 | 65.6 ± 0.8 |
| SNF8 | 1 | 0 | 108.8 ± 0.2 | -36.7 ± 1.8 | 54.2 ± 0.3 |
| SNF9 | 1 | 1 | 98.9 ± 0.6 | -31.6 ± 1.1 | 95.1 ± 0.1 |
Table 13: Observed responses of Dolutegravir loaded Soya Phosphatidyl Ethanolamine based SLN
| Batch | Poloxamer 407 | Cremophor EL | Size (nm) | Zeta potential (mV) | %EE
|
|---|---|---|---|---|---|
| SPF1 | -1 | -1 | 213.5 ± 0.1 | -18.3 ± 1.1 | 53.3 ± 1.0 |
| SPF2 | -1 | 0 | 133.9 ± 0.1 | -23.9 ± 0.7 | 51.2 ± 1.0 |
| SPF3 | -1 | 1 | 105.3 ± 0.2 | -34.2 ± 3.2 | 71.4 ± 1.2 |
| SPF4 | 0 | -1 | 165.1 ± 0.2 | -26.5 ± 1.2 | 55.2 ± 1.0 |
| SPF5 | 0 | 0 | 113.3 ± 0.1 | -19.3 ± 0.1 | 69.3 ± 1.0 |
| SPF6 | 0 | 1 | 103.9 ± 0.1 | -23.1 ± 0.2 | 75.6 ± 1.0 |
| SPF7 | 1 | -1 | 139.9 ± 0.2 | -48.7 ± 0.4 | 61.2 ± 0.1 |
| SPF8 | 1 | 0 | 116.6 ± 0.2 | -45.5 ± 1.2 | 52.3 ± 0.2 |
| SPF9 | 1 | 1 | 93.1 ± 0.2 | -30.6 ± 1.2 | 95.4 ± 1.1 |
Table 14: Observed responses of Dolutegravir loaded Soya Phospholipon 90H based SLN
| Batch | Poloxamer 407 | Cremophor EL | Size (nm) | Zeta potential (mV) | % EE |
|---|---|---|---|---|---|
| SHF1 | -1 | -1 | 194.7 ± 0.2 | -23.3 ± 0.3 | 62.5 ± 1.2 |
| SHF2 | -1 | 0 | 208.7 ± 0.2 | -20.4 ± 0.5 | 54.9 ± 0.1 |
| SHF3 | -1 | 1 | 214.6 ± 0.2 | -44.9 ± 3.2 | 80.1 ± 1.2 |
| SHF4 | 0 | -1 | 137.4 ± 0.1 | -24.4 ± 0.4 | 56.3 ± 0.1 |
| SHF5 | 0 | 0 | 214.5 ± 0.1 | -39.4 ± 1.1 | 78.3 ± 1.1 |
| SHF6 | 0 | 1 | 171.5 ± 0.1 | -35.4 ± 0.2 | 82.5 ± 2.3 |
| SHF7 | 1 | -1 | 165.3 ± 0.1 | -36.8 ± 1.9
|
67.2 ± 0.2 |
| SHF8 | 1 | 0 | 131.8 ± 0.2 | -38.6 ± 2.4 | 58.3 ± 0.1 |
| SHF9 | 1 | 1 | 96.4 ± 0.2 | -30.5 ± 1.1 | 97.4 ± 2.0 |
All the responses observed for 9 runs (3 different bases of solid lipid nanoparticles) were simultaneously fitted to linear, interaction and quadratic models using Design Expert software trial version 12. The comparative values of R2, adjusted R2, predicted R2, PRESS, s.d, % CV at significant p values (P<0.05). A suitable polynomial model for describing the data was selected based on coefficient of determination (R2) and PRESS values. The 3 responses Y1, Y2, Y3 for the 3 different bases of SLN were independent, for SLN prepared with Sphingomyelin, Soya Phosphatidyl Ethanolamine, the responses Y1, Y2 and Y3 followed linear model whereas Phospholipon 90H based SLN response Y1 and Y3 followed linear model and Y2 followed quadratic model. The fitted polynomial equations relating the responses are given in Tables 15-17. Model parameters obtained from Analysis Of Variance (ANOVA) for the responses Y1-Y3 of 3 different bases of SLN are shown in Tables 18-20. These parameters were used to construct the models that describe the effect of the independent variables on the responses (Y1-Y3) (Figures 6-11).
From the ANOVA data, the F value of 3 different bases of SLN i.e. Sphingomyelin, Soya Phosphatidyl Ethanolamine and Phospholipon 90H based formulations were as followed for Sphingomyelin all 3 responses of F value were 2.76, 3.55 and 5.43, for Soya Phosphatidyl Ethanolamine the F values were 41.70, 24.70 and 6.53 and for Phospholipon 90H the F values were 2.76, 3.55 and 5.43 respectively. The P value less than 0.05 for the response factors indicated that the models are significant.

Figure 6: Contour plots for the effects of poloxamer 407 (X1) and Cremophor EL (X2) on particle size (Y1), zeta potential (Y2) and %entrapment efficiency (Y3) in Sphingomyelin based SLN

Figure 7: Contour plots for the effects of poloxamer 407 (X1) and Cremophor EL (X2) on particle size (Y1), zeta potential (Y2) and %entrapment efficiency (Y3) in Soya Phosphatidyl Ethanolamine based SLN

Figure 8: Contour plots for the effects of poloxamer 407 (X1) and Cremophor EL (X2) on particle size (Y1), zeta potential (Y2) and % entrapment efficiency (Y3) in Phospholipon 90H based SLN

Figure 9: Response surface plots for the effects of poloxamer 407 (X1) and Cremophor EL (X2) on particle size (Y1), zeta potential (Y2) and % entrapment efficiency (Y3) in Sphingomyelin based SLN

Figure 10: Response surface plots for the effects of poloxamer 407 (X1) and Cremophor EL (X2) on particle size (Y1), zeta potential (Y2) and % entrapment efficiency (Y3) in Soya Phosphatidyl Ethanolamine based SLN

Figure 11: Response surface plots for the effects of poloxamer 407 (X1) and Cremophor EL (X2) on particle size (Y1), zeta potential (Y2) and % entrapment efficiency (Y3) in Phospholipon 90H based SLN
Table 15: Regression analysis summary of Sphingomyelin based SLN for responses Y1, Y2 and Y3
| Model R2 | R2 | Adjusted R2 | Predicted R2 | PRESS | s.d. | F-value | p-value | Remarks |
|---|---|---|---|---|---|---|---|---|
| Response Y1 (Particle size(nm)=+118.77-13.75 × A-24.20 × B | ||||||||
| Linear | 0.38 | 0.2422 | -0.1647 | 14247 | 29.03 | 2.76 | 0.1164 | - |
| Interactive | 0.395 | 0.1681 | -0.6553 | 20249 | 30.4 | 5 | 0.0816 | Suggested |
| Quadratic | 0.64 | 0.3406 | -2.3531 | 41017 | 27.08 | 2.05 | 0.2101 | - |
| Response Y2 (Zeta Potential mV)=-33.31-2.15 × A-1.87 × B+6.52 × AB | ||||||||
| Linear | 0.127 | -0.0673 | -1.183 | 837.4 | 6.1 | 0.65 | 0.5433 | - |
| Interactive | 0.57 | 0.4097 | -0.5535 | 595.9 | 4.54 | 460 | <0.001 | Suggested |
| Quadratic | 0.741 | 0.5261 | -1.6651 | 1022.4 | 4.07 | 1.98 | 0.2183 | - |
| Response Y3 Entrapment efficiency (%)=+15.57+0.10667 × A+0.24667 × B | ||||||||
| Linear | 0.547 | 0.4459 | 0.1473 | 1690 | 9.99 | 5.43 | 0.0285 | Suggested |
| Interactive | 0.687 | 0.14 | -35.966 | 73263 | 12.45 | 0.057 | 0.9453 | - |
| Quadratic | 0.678 | 0.4103 | -1.1821 | 21 | 4324.67 | 1.06 | 0.4036 | - |
| SS: Sum of Squares, Df: Degrees of freedom, MS: Mean sum of Squares, SD: Standard deviation, F: Fischer’s ratio | ||||||||
Table 16: Regression analysis summary of Soya Phosphatidyl Ethanolamine based SLN for responses Y1, Y2 and Y3
| Model R2 | R2 | Adjusted R2 | Predicted R2 | PRESS | s.d. | F-value | p-value | Remarks | |
|---|---|---|---|---|---|---|---|---|---|
| Response Y1 (Particle size(nm)=+114.83-17.22 × A-36.06 × B+15.44 × AB+7.45 × A2+16.95 × B2 | |||||||||
| Linear | 0.7882 | 0.7411 | 0.5133 | 5915 | 16.9 | 16.7 | 0.0009 | Suggested | |
| Interactive | 0.9964 | 0.9901 | 0.5769 | 5142.5 | 3.3 | 13.5 | 0.0166 | - | |
| Quadratic | 0.972 | 0.9487 | 0.7239 | 3355.5 | 7.5 | 11.3 | 0.0092 | - | |
| Response Y2 (Zeta Potential mV)=-21.0-8.07 × A+0.95 × B+8.50 × AB-11.50 × A2-1.55 × B2 | |||||||||
| Linear | 0.3357 | 0.1881 | -0.4729 | 1736.6 | 9.3 | 2.2 | 0.1587 | - | |
| Interactive | 0.9743 | 0.9293 | -1.9638 | 3494.5 | 2.7 | 4.6 | 0.0625 | - | |
| Quadratic | 0.9537 | 0.9151 | 0.618 | 450.46 | 3.02 | 24.1 | 0.0014 | Suggested | |
| Response Y3 Entrapment efficiency (%)=+66.17+5.50 × A+12.00 × B | |||||||||
| Linear | 0.5921 | 0.5015 | 0.2009 | 1411 | 8.95 | 6.53 | 0.0177 | Suggested | |
| Interactive | 0.7809 | 0.3976 | -24.623 | 45242.1 | 9.83 | 0.45 | 0.6665 | - | |
| Quadratic | 0.7317 | 0.5081 | -0.9619 | 3464 | 8.89 | 1.15 | 0.3765 | - | |
| SS: Sum of squares, Df: Degrees of freedom, MS: Mean sum of squares, S.D.: Standard deviation, F: Fischer’s ratio | |||||||||
Table 17: Regression analysis summary of Phospholipon 90H based SLN for responses Y1, Y2 and Y3
| Model R2 | R2 | Adjusted R2 | Predicted R2 | PRESS | s.d. | F-value | p-value | Remarks |
|---|---|---|---|---|---|---|---|---|
| Response Y1 (Particle size(nm)=+205.33-37.26 × A-2.64 × B-22.14 × AB-16.03 × A2 -31.48 × B2 | ||||||||
| Linear | 0.45199 | 0.3301 | -0.0286 | 19054.8 | 33.5 | 3.7 | 0.0668 | Suggested |
| Interactive | 0.8773 | 0.6626 | -13.654 | 20440.5 | 32 | 1 | 0.4369 | - |
| Quadratic | 0.8144 | 0.6597 | -0.4775 | 27370.5 | 23.9 | 4.1 | 0.0739 | - |
| Response Y2 (Zeta Potential mV)=-34.41-2.88 × A-4.45 × B+6.97 × AB | ||||||||
| Linear | 0.2437 | 0.0756 | -0.6428 | 1137.4 | 7.6 | 1.4 | 0.2846 | Suggested |
| Interactive | 0.7987 | 0.4464 | -23.09 | 16684.3 | 5.9 | 1.7 | 0.2873 | - |
| Quadratic | 0.6245 | 0.3115 | -2.1611 | 2188.6 | 6.5 | 0.8 | 0.4932 | - |
| Response Y3 Entrapment efficiency (%)=+72.09+4.23 × A+12.33 × B | ||||||||
| Linear | 0.5837 | 0.4912 | 0.1982 | 1401.4 | 8.9 | 6.3 | 0.0194 | Suggested |
| Interactive | 0.7123 | 0.2088 | -33.133 | 59656.8 | 11.2 | 0.084 | 0.9214 | - |
| Quadratic | 0.7003 | 0.4505 | -1.0525 | 3587.2 | 9.3 | 0.94 | 0.4416 | - |
Table 18: Model parameters (ANOVA) for the dependent responses of Sphingomyelin based SLN
| Source | SS | df | MS | p-value | Significance |
|---|---|---|---|---|---|
| Response Y1 | |||||
| Model | 4648.2 | 2 | 2324.1 | 0.1164 | NS |
| X1 | 1134.3 | 1 | 1134.3 | 0.2758 | NS |
| X2 | 3513.8 | 1 | 3513.8 | 0.715 | NS |
| Residual | 7584.3 | 9 | 842.7 | - | - |
| Total | 12232.5 | 11 | - | - | - |
| Response Y2 | |||||
| Model | 218.9 | 3 | 72.9 | 0.0676 | NS |
| X1 | 27.7 | 1 | 27.7 | 0.2792 | NS |
| X2 | 20.9 | 1 | 20.9 | 0.3431 | NS |
| X1X2 | 170.3 | 1 | 170.3 | 0.0206 | NS |
| Residual | 170.3 | 1 | 20.5 | - | - |
| Total | 164.6 | 8 | - | - | - |
| Response Y3 | |||||
| Model | 1083.3 | 2 | 541.6 | 0.0285 | S |
| X1 | 170.6 | 1 | 171.6 | 0.2235 | NS |
| X2 | 912.6 | 1 | 912.6 | 0.0144 | S |
| Residual | 898.5 | 9 | 99.8 | - | - |
| Total | 1981.8 | 11 | - | - | - |
| SS: Sum of squares; Df: Degrees of freedom; MS: Mean sum of squares | |||||
Table 19: Model parameters (ANOVA) for the dependent responses of Soya Phosphatidyl Ethanolamine based SLN
| Source | SS | df | MS | p-value | Significance |
|---|---|---|---|---|---|
| Response Y1 | |||||
| Model | 11813 | 5 | 2363 | 0.0001 | S |
| X1 | 1779.5 | 1 | 1780 | 0.0014 | S |
| X12 | 7799.7 | 1 | 7800 | <0.0001 | S |
| X2 | 147.8 | 1 | 147.8 | 0.1573 | NS |
| X22 | 765.8 | 1 | 765.8 | 0.0104 | - |
| X1 X2 | 953.8 | 1 | 953.8 | 0.0063 | S |
| Residual | 339.9 | 3 | 56.6 | 0.0001 | S |
| Total | 12153 | 11 | - | 0.0014 | S |
| Response Y2 | |||||
| Model | 1124.4 | 5 | 224.8 | 24.7 | 4.3 |
| X1 | 390.4 | 1 | 390.4 | 42.8 | 5.9 |
| X12 | 5.4 | 1 | 5.4 | 0.59 | 5.9 |
| X2 | 352.6 | 1 | 352.6 | 38.7 | 5.9 |
| X22 | 6.4 | 1 | 6.4 | 0.72 | 5.9 |
| X1 X2 | 289 | 1 | 289 | 31.7 | 5.9 |
| Residual | 54.6 | 6 | 9.1 | - | - |
| Total | 1179.1 | 11 | - | - | - |
| Response Y3 | |||||
| Model | 1045.5 | 2 | 522.7 | 6.5 | 4.2 |
| X1 | 181.5 | 1 | 181.5 | 2.2 | 5.1 |
| X2 | 864 | 1 | 864 | 10.8 | 5.1 |
| Residual | 720.1 | 9 | 80.02 | - | - |
| Total | 1765.6 | 11 | - | - | - |
| SS: Sum of squares; Df: Degrees of freedom; MS: Mean sum of squares | |||||
Table 20: Model parameters (ANOVA) for the dependent responses of Phospholipon 90H based SLN
| Source | SS | df | MS | p-value | Significance |
|---|---|---|---|---|---|
| Response Y1 | |||||
| Model | 4648.2 | 2 | 2324.1 | 0.1164 | NS |
| X1 | 1134.3 | 1 | 1134.3 | 0.2758 | NS |
| X2 | 3513.8 | 1 | 3513.8 | 0.715 | NS |
| Residual | 7584.3 | 9 | 842.7 | - | - |
| Total | 12232.5 | 11 | - | - | - |
| Response Y2 | |||||
| Model | 218.9 | 3 | 72.9 | 0.0676 | NS |
| X1 | 27.7 | 1 | 27.7 | 0.2792 | S |
| X2 | 20.9 | 1 | 20.9 | 0.3431 | S |
| Residual | 170.3 | 1 | 170.3 | 0.0206 | S |
| Total | 164.6 | 8 | 20.5 | - | - |
| Response Y3 | |||||
| Model | 1083.3 | 2 | 541.6 | 0.0285 | S |
| X1 | 170.6 | 1 | 171.6 | 0.2235 | NS |
| X2 | 912.6 | 1 | 912.6 | 0.0144 | S |
| Residual | 898.5 | 9 | 99.8 | - | - |
| Total | 1981.8 | 11 | - | - | - |
| SS: Sum of squares; Df: Degrees of freedom; MS: Mean sum of Squares | |||||
For the Sphingomyelin based SLN, the response observation for particle size X1, X2, were found to be non-significant terms, the response observation for zeta potential X1, X2, X1X2 were found to be non-significant terms response observation for % EE X1 was found to be non-significant term and X2 was found to be significant term.
For the Soya Phosphatidyl Ethanolamine based SLN, the response observation for particle size X1, X2, X22, X1X2 were found to be significant terms, X12 found to be non significant term. The response observation for zeta potential X1, X12, X1X2 were found to be significant terms. X2, X22, were found be non significant terms response observation for % EE X1 was found to be non-significant term and X2 was found to be significant term.
For the Phospholipon 90H based SLN, the response observation for particle size X1, X2, were found to be non-significant terms, the response observation for zetapotential X1, X2, X1X2 were found to be significant terms response observation for % EE X1 was found to be non-significant term and X2 was found to be significant term. The 3 different bases of SLN “Pred R-Squared” value of all 3 responses are not in reasonable agreement with the “Adj R-Square” value.
Optimization
To optimize 3 responses with different targets, a multi-criteria decision approach, like a numerical optimization technique by the desirability function and graphical optimization technique by the overlay plot were used. The optimized formulation was obtained by applying constraints (goals) on dependent (response) and independent variables (factors). Optimum formulation was selected based on the criteria of minimum particle size (96.04 nm ± 0.2 nm), higher zeta potential (-30.5 mV ± 1.1 mV) and maximum % EE (97.4% ± 0.2%). Various feasibility and grid searches were executed to establish the optimum formulation by plotting desirability function response plot and overlay plot, where one solution was found with a desirability of 1.0. The recommended poloxamer 407 and Cremophor EL were calculated by the Design Expert 12 software trial version.
Optimization was carried out by both numerical optimization and graphical optimization techniques. The 3 different bases of SLN desirability and overlay plots are shown respectively in Figures 12-14. The desirability function was found to be higher (0.806, 0.837 and 0.891, which are near to 1) for the optimized formula indicating the suitability of the formulations. The optimized SLN contain 200 mg of poloxamer 407 and 200 mg of Cremophor EL for all the 3 different phospholipids. Predicted model formulations were found matching with the optimized SNF9, SPF9 and SHF9 formulations.
From the above Table 21, the optimized SLN contain 200 mg of poloxamer 407 and 200 mg of Cremophor EL for Sphingomyelin, Soya Phosphatidyl Ethanolamine, and Phospholipon 90H based SLN formulations. 50 mg of Doultagravir and 400 mg of phospholipids were kept constant in all the formulations. The prepared optimized formulations were found to be of good quality fulfilling all the requirements of nanoparticles.

Figure 12: Desirability and overlay plots of Sphingomyelin based SLN

Figure 13: Desirability and overlay plots of Soya Phosphatidyl Ethanolamine based SLN

Figure 14: Desirability and overlay plots of Phospholipon 90H based SLN
Table 21: Optimized formula of solid lipid nanoparticles
| Solid Lipid Nanoparticles | ||
|---|---|---|
| Base | Poloxamer 407 | Cremophor EL |
| Sphingomyelin | 200 mg | 200 mg |
| Soya Phosphatidyl Ethanolamine | 200 mg | 200 mg |
| Phospholipon 90H | 200 mg | 200 mg |
Surface morphology by transmission electron microscopy
Transmission electron microscopy of the tristearin based SHF9 formulation was performed to elucidate the surface morphology as shown in Plate (Figure 15). The SLN obtained were in nanometer-size and spherical in shape with well-defined periphery at 50000X magnification. The size of the solid lipid nanoparticles was found to be in agreement with the Malvern Zetasizer particles size distribution for the selected sample.
DSC
DSC analysis was performed on Dolutegravir pure drug, individual phospholipids, physical mixtures prepared with drug and each phospholipid (1:1) and SNF9, SPF9 and SHF9 formulations. DSC thermograms of pure drug, Sphingomyelin, physical mixture of drug and Sphingomyelin and SNF9 formulation prepared with Sphingomyelin are shown. Similarly that of Soya Phosphatidyl Ethanolamine are shown and Phospholipon 90H are shown (Figure 16). The pure drug Dolutegravir showed a sharp endothermic peak at 141.9°C. Sphingomyelin, Soya Phosphatidyl Ethanolamine and Phospholipon 90H showed sharp endothermic peaks at 60.36°C, 65.19°C and 75.32°C. Physical mixture of pure drug Dolutegravir with Sphingomyelin, Soya Phosphatidyl Ethanolamine and Phospholipon 90H showed sharp and broad endothermic peak at 59.45°C and 136.69°C, 64.57°C and 131.34°C, 73.90°C and 137.71°C respectively.

Figure 15: Plate-surface morphology of SHF9 by TEM studies
Dolutegravir SLN with Sphingomyelin, Phosphatidyl Ethanolamine and Phospholipon 90H showed a reduced peak at 55.19°C, 61.41°C and 69.66°C shifted towards the lower temperature. The peak corresponding to drug completely disappeared indicating the complete entrapment of the drug in the SLN. This suggested that Doultgravir was not in crystalline state but was in amorphous state in the SLN formulations.
The method of preparation hot homogenization followed by ultrasonication and presence of surfactant could not allow the drug to crystallize (Freitas and Muller, 1999). Melting points of Sphingomyelin, Soya Phosphatidyl Ethanolamine and Phospholipon in SLN form were depressed when compared to melting points of corresponding bulk phospholipids. This melting point depression might be due to small particle size (nanometer range), their high specific surface area.

Figure 16: DSC thermograms A) Sphingomyelin; B) Soya Phosphatidyl Ethanolamine and C) Phospholipon 90H based optimized formulations
Powder X-Ray Diffractometry (PXRD)
PXRD patterns of Dolutegravir exhibits sharp peaks at diffraction angle around 9.7 indicating crystalline nature of Dolutegravir. Results are shown in the Figure 17. All the Phospholipids showed sharp peaks at diffraction angles around 19.5. In the physical mixtures the intensity of the sharp peaks was reduced as compared to the pure drug and phospholipid. The intensities of the peaks were further reduced and broad for simvastatin loaded SLN of Sphingomyelin, Soya Phosphatidyl Ethanolamine and Phospholipon 90H. This suggests that Dolutegravir was not in crystalline form in the formulation. However, the characteristic peaks of Phospholipon 90H were most decreased in SLN, Similarly crystallinity of Sphingomyelin, Soya Phosphatidyl Ethanolamine was also decreased in SLN.

Figure 17: Powder x-ray diffractometry (PXRD) patterns of Dolutegravir
In vitro drug release
The drug release testing is a fundamental part of drug product development and manufacturing and is also employed as a quality control tool to monitor batch-to-batch consistency of the drug release from SLN systems. The SLN drug release mechanism was influenced by various physicochemical factors such as particle size, % entrapment efficiency and poloxamer 407 and Cremophor EL composition. The Franz diffusion process was used for drug release. The in vitro release profile of optimized formulations with desired particle size, zeta potential and entrapment efficiency viz. SNF9, SPF9 and SHF9 was studied using cellulose membrane as semi permeable membrane. The study revealed that the release of the drug from the formulations depends on the relative amounts of poloxamer 407 and Cremophor EL and phospholipids present.
SLN formulations SNF9, SPF9 and SHF9 released 31.78%, 32.55% and 37.17% of Dolutegravir respectively for 36 h. 98% of drug release was observed in 36 h for pure Dolutegravir dispersed in pH 6.8 buffer. The results indicated slower release of Dolutegravir from the prepared SLN compared to pure drug which may be due to the lipid nature of the prepared SLN and homogeneous dispersion of the drug in the lipid matrix.
In vitro release kinetics
From Table 22, drug release kinetics of SLN formulations indicated that drug release followed zero order and non-Fickian diffusion anomalous super case-II manner and absence of any burst release, which indicated complete entrapment of drug in the lipid matrix without any adsorption of simvastatin on the surface of SLN. No significant variation was observed in release of Dolutegravir from different bases of SLN. The in vitro drug release profiles of SLN are shown in Figure 18.
Table 22: Drug release kinetics of SLN formulations
| Formulation
|
Zero order | First order | Higuchi | Peppas | |||
|---|---|---|---|---|---|---|---|
| SNF9 | 0.989 | 0.873 | 0.982 | 0.0092 | 0.928 | 0.993 | 0.931 |
| SPF9 | 0.992 | 0.904 | 0.986 | 0.0092 | 0.944 | 0.994 | 0.944 |
| SHF9 | 0.998 | 1.045 | 0.997 | 0.0115 | 0.962 | 0.995 | 0.991 |

Figure 18: Comparison of cumulative % drug release of pure drug with optimized formulations prepared by different lipids
Conclusion
A 32 full factorial design has been employed to produce Dolutegravir loaded SLN by using hot homogenization technique followed by ultra-sonication method. The statistical optimization reduced the number of experiments that were carried out for obtaining formulations with desired properties. The derived polynomial equations, response and contour plots helped in predicting the values of selected independent variables for preparation of optimum SLN with desired properties. Solid lipid nanoparticles showed minimum particles size, optimum zeta potential and higher %EE. This experimental design revealed that Phospholipon 90H based formulation showed better result compared to Sphingomyelin, Soya Phosphatidyl Ethanolamine based formulations which could be due to maximum carbon chain length and high phase transition temperature. The drug excipients characterization parameters reveal that there is no drug-excipients interaction.
Acknowledgement
None.
Conflict Of Interest
Authors have no conflict of interest to declare.
References
- P. Ahlin, J. Kristl, S. Kobar, Optimization of procedure parameters and physical stability of solid lipid nanoparticles in dispersions, Acta Pharm, 48(1998):257-267.
- A. Alberts, J. Chen, G. Kuron, V. Hunt, J. Huff, et al. Mevinolin: A highly potent competitive inhibitor of hydroxymethylglutaryl-coenzyme a reductase and a cholesterol-lowering agent, Proc Nat Acad Sci, 77(1980):3957-3961.
- D.G. Angelis, Influence of statin characteristics on their safety and tolerability, Int J Clin Pract, 58(2004):945-955.
- N. Arjun, V. Kishan, Preparation, characterization and evaluation of quetiapine fumarate solid lipid nanoparticles to improve the oral bioavailability, J Pharm,(2013):1-7.
- C. Augsten, M.A. Kiselev, R. Gehrke, G. Hause, K. Mader, A detailed analysis of biodegradable nanospheres by different techniques: A combined approach to detect particle sizes and size distributions, J Pharm Biomed Anal, 47(2008):95-102.
- A. Bargoni, R. Cavalli, O. Caputo, Solid lipid nanoparticles in lymph and plasma after duodenal administration to rats, Pharm Res, 15(1998):745-750.
- R. Bhattacharya, P. Mukherjee, Biological properties of "naked" metal nanoparticles, Adv Drug Deli Rev, 60(2008):1289-1306.
- N. Garti, K. Sato, Crystallization and polymorphism of fats and fatty acids, Marcel Dekker Inc, (1988):189-226.
- H. Bunjes, B. Siekmann, K. Westesen, Emulsions of super-cooled melts-a novel drug delivery system, Submicron Emulsions Drug Targ Deliv, (1998):175-204.
- G. Carlucci, P. Mazzeo, L. Biordi, M. Bologna, Simultaneous determination of simvastatin and its hydroxyl acid form in human plasma by HPLC with UV detection, J Pharm Biomed Anal, 10(1992):693-697.
- R. Cavalli, E. Marengo, L. Rodriguez, M.R. Gasco, Effect of some experimental factors on the production process of solid lipid nanoparticles, Eur J Pharm Biopharm, 43(1996):110-115.
- J. Chen, W.T. Dai, Z.M. He, L. Gao, X. Huang, et al. Fabrication and evaluation of curcumin-loaded nanoparticles based on solid lipid as a new type of colloidal drug delivery system, Indian J Pharm Sci, 75(2013):178-184.
- R. Daniels, Galenic principles of modern skin care products, Skin Care Forum Online, 2001.
- M. `Demirel, Y. Yazan, R.H. Muller, F. Kilic, B. Bozan, Formulation and in vitro-in vivo evaluation of piribedil solid lipid micro and nanoparticles, Molecules, 25(2020):5877-5891.
Copyright: © 2023 Prasanth Y, et al. This is an open access article distributed under the terms of the Creative Commons Attribution License, which permits unrestricted use, distribution, and reproduction in any medium, provided the original work is properly cited.