Research Article: Journal of Drug and Alcohol Research (2022) Volume 11, Issue 7
Development and Validation of Novel Analytical Method for the Simultaneous Estimation of Bempadoic Acid and Ezetimibe in Bulk and Pharmaceutical Dosage Form by RP-UPLC
A Sai Datri1*, KS Nataraj2 and A Lakshmana Rao32Department Pharmaceutical Sciences, Shri Vishnu College of Pharmacy, India
3Department Pharmaceutical Sciences, V. V. Institute of Pharmaceutical Sciences, India
A Sai Datri, Department Pharmaceutical Sciences, Andhra University, India, Email: sai.dhatri_arige@yahoo.co.in
Received: 04-Jul-2022, Manuscript No. jdar-22-69778; Editor assigned: 06-Jul-2022, Pre QC No. jdar- 22-69778(PQ); Reviewed: 20-Jul-2022, QC No. jdar-22-69778; Revised: 25-Jul-2022, Manuscript No. jdar-22- 69778 (R); Published: 01-Aug-2022, DOI: 10.4303/jdar/236190
Abstract
Objectives: A selective and novel method has been optimized for the evaluation of Bempadoic Acid and Ezetimibe using RP-UPLC.
Materials and methods: The principle analytes chromatogram was run through SB C18 100 x 1.8 mm, 2 μm. Mobile Phase containing 0.01% OPA: Acetonitrile (60:40%, v/v) was pumped through column at 0.3 mL/ min flow rate. Optimized wavelength selected was 226 nm.
Results: The retention times of Bempadoic Acid and Ezetimibe were 1.865 min and 1.234 min respectively with a total run time of 5 min. The calibration curve indicates that the correlation coefficient (r2) was superior with a value of 1.000 in the linear range of 22.5-135 μg/mL for Bempadoic Acid and 1.25-7.5 μg/mL for Ezetimibe. The lower limits of quantification and detection for Bempadoic Acid and Ezetimibe were found to be 2.34 μg/mL and 0.77 μg/mL and 0.28 μg/mL and 0.09 μg/ mL, respectively.
Conclusion: The developed method was validated and applied to the bulk drug and formulation of Bempadoic Acid and Ezetimibe. All the results obtained with this method were accurate and precise.
Keywords
Bempadoic acid; Ezetimibe; Bulk drug; Formulation; UPLC
Introduction
Bempadoic Acid [1] (8-hydroxy-2,2,14,14-tetramethylpentadecanedioic acid) is a prodrug that requires activation in the liver. The very-long-chain acyl-CoA synthetase-1 (ACSVL1) enzyme is responsible for its activation to ETC-1002-CoA, the pharmacologically active metabolite. ATP lyase (also known as ATP synthase) plays an important part of cholesterol synthesis. BETC-1002-CoA directly inhibits this enzyme after the parent drug is activated in the liver by coenzyme A (CoA). This inhibition leads to up regulation of the LDL cholesterol receptor, reducing serum LDL-C via increased uptake and LDL clearance in the liver. Ezetimibe2 [(3R,4S)-1-(4-fluorophenyl)-3-[(3S)-3- (4-fluorophenyl)-3-hydroxypropyl]-4-(4-hydroxyphenyl) azetidin-2-one] mediates blood cholesterol-lowering effect via selectively inhibiting the absorption of cholesterol and phytosterol by the small intestine without altering the absorption of fat-soluble vitamins and nutrients.
Based on a literature survey, only two analytical methods are reported for this new formulation, i.e., Bempadoic Acid and Ezetimibe. One is with HPLC3 and other is with UPLC4. For the Bempadoic Acid and Ezetimibe combination, there was a lack of sensitive analytical methods for the identification and quantification in bulk and in formulations. The proposed methods are simple, convenient, precise, accurate, and economical than the reported method and validated as per ICH guidelines [2].
Materials and Methods
Bempadoic Acid (Figure 1), Ezetimibe (Figure 2) received from Spectrum Labs and Acetonitrile, Phosphate buffer, Methanol, Potassium dihydrogen ortho phosphate buffer, Ortho-phosphoric acid are from Rankem. The formulation NEXLIZET (Ezetimibe 100 mg, Bempedoic Acid 44 mg) was brought from local market. WATERS AQCUITY UPLC system equipped with quaternary pumps, UV detector and Auto sampler integrated with Empower 2 Software are used for this method.
Diluent
Based up on the solubility of the drugs, diluent was selected, Methanol and Water taken in the ratio of 50:50.
Buffer (0.1N Potassium dihydrogen Ortho phosphate)
Accurately weighed 1.36 gm of Potassium dihydrogen Ortho phosphate in a 1000 mL of Volumetric flask, add about 900 mL of milli-Q water added and degas to sonicate and finally make up the volume with water then added 1 mL of Triethylamine then PH adjusted to 3.8 with dil. Orthophosphoric acid solution.
0.1%OPA buffer
1 mL of Ortho phosphoric acid was diluted to 1000 mL with UPLC grade water.
0.01N Ammonium acetate buffer
Accurately weighed 0.77 gm of Ammonium acetate in a 1000 mL of volumetric flask add about 900 mL of milli-Q water added and degas to sonicate and finally make up the volume with water to get 0.01N Ammonium acetate buffer.
Preparation of standard stock solutions
Accurately weighed 45 mg of Bempedoic Acid, 2.5 mg of Ezetimibe and transferred to 25 mL volumetric flasks and 3/4th of diluents was added to these flasks and sonicated for 10 minutes. Flask were made up with diluents and labeled as standard stock solution. (900 μg/mL of Bempedoic Acid and 50 μg/mL Ezetimibe).
Preparation of standard working solutions (100% solution)
1 mL from each stock solution was pipetted out and taken into a 10 mL volumetric flask and made up with diluent. (90 μg/mL of Bempedoic Acid and 5 μg/mL Ezetimibe)
Optimization of chromatographic conditions
After a series of trials, the final chromatographic conditions were determined as follows. The mobile phase was 0.1% OPA: Acetonitrile (60:40, V/V), and the stationary phase was a SB C18 column with dimensions 100 x 1.8 mm, 2 μm to obtain the best peak shape. The separation of Bempadoic Acid and Ezetimibe was good at 226 nm with a column temperature of 30°C, a flow rate of 0.3 mL/min, and a sample volume of 2 μL.
Preparation of sample stock solutions
5 tablets were weighed and the average weight of each tablet was calculated, then the weight equivalent to 1 tablet was transferred into a 100 mL volumetric flask, 50 mL of diluents was added and sonicated for 25 min, further the volume was made up with diluent and filtered by filters. (900 μg/mL of Bempedoic Acid and 50 μg/mL Ezetimibe).
Preparation of sample working solutions (100% solution)
1 mL of filtered sample stock solution was transferred to 10 mL volumetric flask and made up with diluent. (90 μg/mL of Bempedoic Acid and 5 μg/mL of Ezetimibe).
Validation of the analytical method
Validation was performed for the developed method within stringent limits to test the efficiency of this method: To verify that the system produced consistent results with the optimized method, the standard was injected 6 times with the criteria of % relative standard deviation (RSD) for retention time (RT) and area not more than (NMT) 2.0%, theoretical plates not less than (NLT) 3000 plates, tailing factor NMT 1.5, and resolution NLT 4.
Selectivity
To verify the method validation in terms of selectivity and exactness, triplicate preparations of 100% concentration, i.e., 900 μg/mL of Bempedoic Acid and 50 μg/mL Ezetimibe were injected. Then, one blank and a placebo were also injected to test for carryover. The limit of specificity is that it should pass the system suitability criteria, and there should not be an RT shift for any of the three preparations.
Precision
After passing the specificity and system suitability criteria, the method was verified for system precision and method precision with the limit of % RSD for the RT and area NMT 2%. The intermediate precision was verified on the next day with another column by setting the limit as % RSD for the RT and NMT 2% for the area.
Accuracy and recovery
To verify the method accuracy, triplicate preparations were prepared at 50%, 100%, and 150% of the 100% concentrations (900 μg/mL of Bempedoic Acid and 50 μg/mL Ezetimibe) by spiking the standard into the diluent. The percent recovery was calculated with acceptance criteria of 95-105%.
Linearity
The method linearity was verified with 5 dilutions of the 100% concentration: 22.5-135 μg/mL for Bempedoic Acid and 1.25-7.5 μg/mL for Ezetimibe. The acceptance criterion of the regression coefficient (R2) was NLT 0.99.
Robustness
To verify the method efficiency when minor changes occurred in optimized method parameters such as mobile- phase composition, column temperature and flow rate, and buffer pH, these parameters were tested with the criteria that they should pass the system suitability criteria.
Lower Level of Quantification (LOQ)
By considering the 10% concentration of the target concentration, the sample was injected into the system with the acceptance criteria S/N ratio NLT 10. From the lower LOQ, preparations of different concentrations were injected to identify the detectability with the acceptance criteria 3:1, and the minimum detectability was five times out of six injections from the same concentration.
Lower level of quantification precision
LOQ precision was verified with the limit NMT 2.0% for the RT and area. Assessment of stability of the standard and mobile phase the prepared mobile phase and standard preparations were verified for stability up to 72 hours.
Degradation behavior
To test the developed method for stability indicating method the formulation sample was subjected to acid, base, thermal, photo, peroxide and water degradation were carried with the aim of detection of degradants in the chromatogram. Acid degradation was carried out by adding 20 mL of 0.1N HCL to the stock solution and from that 1 mL was removed and added to a 1000 mL volumetric flask and the volume adjusted to the mark. In the same way, 2 mL 1N NaOH was added to test for base degradation. To test for thermal degradation, the sample was subjected to heat at 105°C for 3 hours and the sample prepared as per the assay procedure. For photo degradation, the sample was exposed to ultraviolet light with intensity NLT 2000 lux power for 6 hours and the sample prepared as per the assay procedure. For peroxide degradation, 2 mL H2O2 were added to the stock 1000 mL volumetric flask, 1 mL was removed and added to a 1000 mL flask, the volume adjusted to the mark with the diluent, and the sample was injected. Stress testing under neutral conditions was studied by refluxing the drug in water for 1 hrs at a temperature of 60°C. For UPLC study, the resultant solution was diluted to 90 μg/mL and 5 μg/mL solution and 10 μl were injected into the system and the chromatograms were recorded to assess the stability of the sample.
Statistical analysis
The data were processed through the Q Sight software, and the results were calculated as mean and ± SD for the accuracy and the RSD was calculated for the precision. The coefficient of regression was also calculated in the linearity parameter.
Results
Clear separation and good resolution without any carryover were achieved with this method as shown in Figures 1-27. The system suitability acceptance criteria were also found to be satisfactory as shown in Figures 3-6 and Tables 1-5. The LOQ for Bempadoic Acid and Ezetimibe was 0.77 μg/mL and 2.34 μg/mL shown in Tables 6-10 and clear detection is shown in Figure 13. The LOQ precision was also performed to evaluate the repeatability at the lower end of the quantification range. The lower limit of detection (LOD) for Bempadoic Acid and Ezetimibe was 0.09 and 0.28 as shown in Table 7, and clear detection is shown in Figure 12. From these results, we can conclude that the method was stable. The method was verified for robustness as well as interday and intraday precision. The LOQ and LOD were identified by injecting the lower concentrations with the S/N ratio criteria, and the drugs were detected six times out of six injections. To evaluate the method’s capability of producing precise results with minor variations in flow, mobile-phase composition, pH, and column temperature variations, a test for robustness was performed. The results are shown in the Figures 14-19 and Table 8. The results prove that the method was stable to produce consistent results with minor variations of the method parameters [3-5].
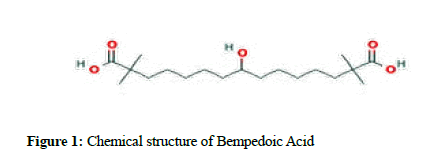
Figure 1: Chemical structure of Bempedoic Acid
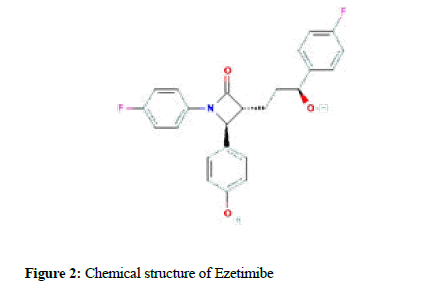
Figure 2: Chemical structure of Ezetimibe
Figure 3: Blank chromatogram
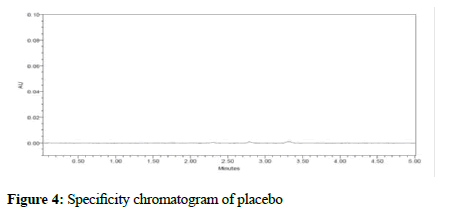
Figure 4: Specificity chromatogram of placebo
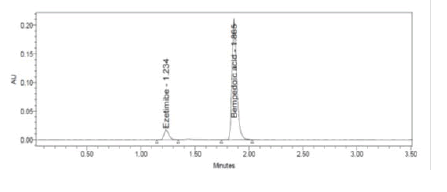
Figure 5: Typical Chromatogram
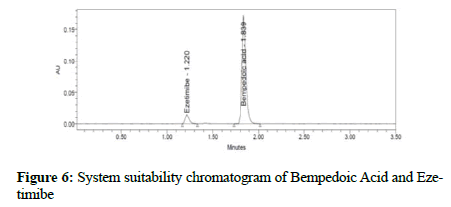
Figure 6: System suitability chromatogram of Bempedoic Acid and Ezetimibe
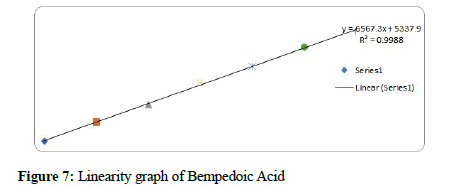
Figure 7: Linearity graph of Bempedoic Acid
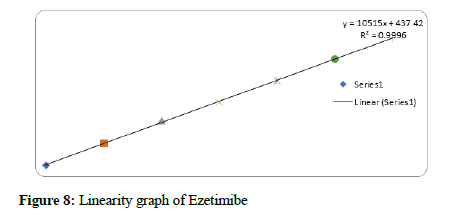
Figure 8: Linearity graph of Ezetimibe
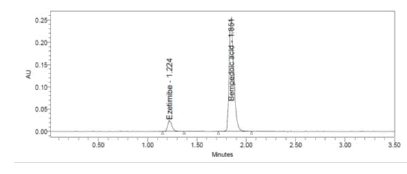
Figure 9: 50% accuracy level chromatogram of Bempedoic Acid and Ezetimibe
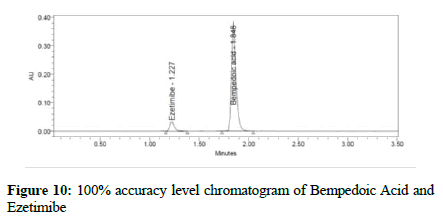
Figure 10:100% accuracy level chromatogram of Bempedoic Acid and Ezetimibe
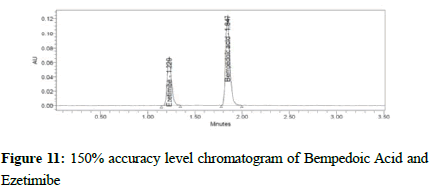
Figure 11:150% accuracy level chromatogram of Bempedoic Acid and Ezetimibe
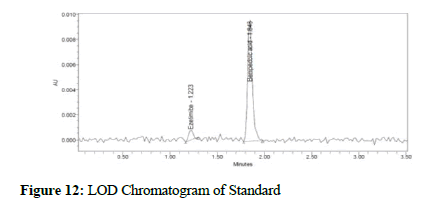
Figure 12: LOD Chromatogram of Standard
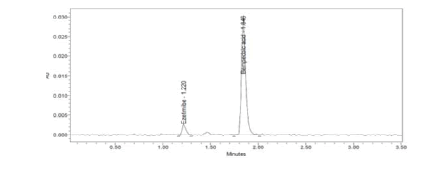
Figure 13: LOQ Chromatogram of Standard
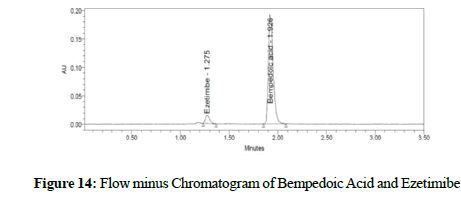
Figure 14: Flow minus Chromatogram of Bempedoic Acid and Ezetimibe
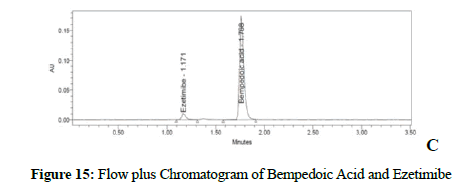
Figure 15: Flow plus Chromatogram of Bempedoic Acid and Ezetimibe
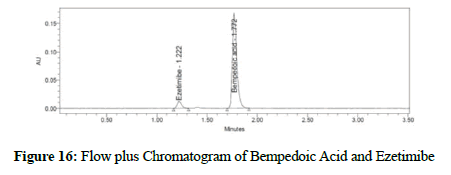
Figure 16: Flow plus Chromatogram of Bempedoic Acid and Ezetimibe
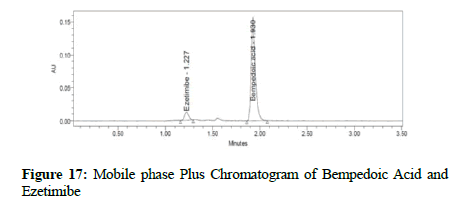
Figure 17: Mobile phase Plus Chromatogram of Bempedoic Acid and Ezetimibe
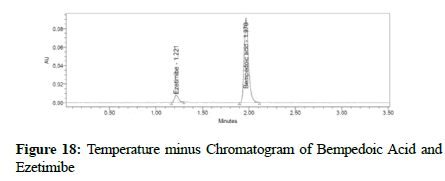
Figure 18: Temperature minus Chromatogram of Bempedoic Acid and Ezetimibe
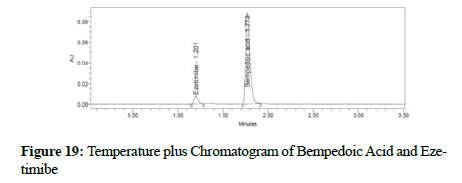
Figure 19: Temperature plus Chromatogram of Bempedoic Acid and Ezetimibe

Figure 20: Chromatogram of working standard solution
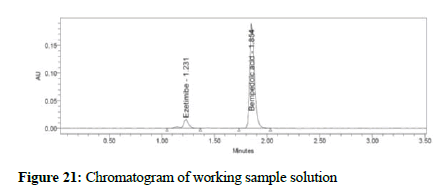
Figure 21: Chromatogram of working sample solution
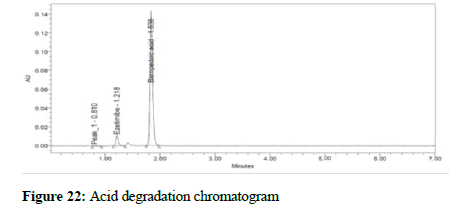
Figure 22: Acid degradation chromatogram
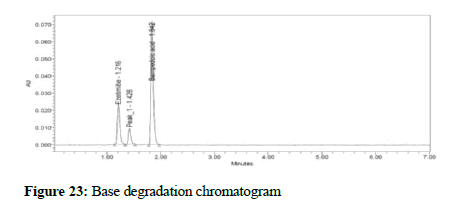
Figure 23: Base degradation chromatogram
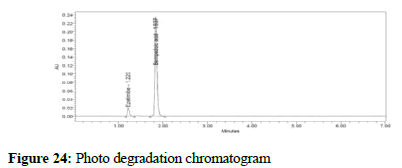
Figure 24: Photo degradation chromatogram
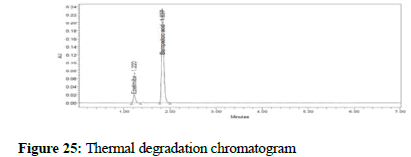
Figure 25: Thermal degradation chromatogram
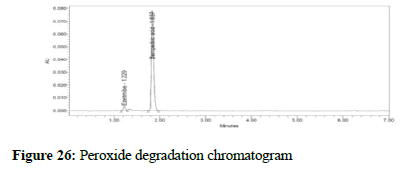
Figure 26: Peroxide degradation chromatogram
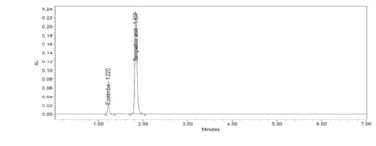
Figure 27: Water degradation chromatogram
| S. No. | Bempodic Acid | Ezetimibe | Resolution | ||||
|---|---|---|---|---|---|---|---|
| RT (min) | USP Plate Count | Tailing | RT (min) | USP Plate Count | Tailing | ||
| 1 | 1.835 | 8207 | 1.39 | 1.217 | 3442 | 1.24 | 7.5 |
| 2 | 1.839 | 7288 | 1.29 | 1.220 | 3213 | 1.24 | 7.3 |
| 3 | 1.856 | 8728 | 1.38 | 1.232 | 3482 | 1.20 | 7.2 |
| 4 | 1.857 | 8623 | 1.38 | 1.233 | 3747 | 1.15 | 7.5 |
| 5 | 1.865 | 7442 | 1.23 | 1.234 | 3626 | 1.23 | 7.5 |
| 6 | 1.865 | 8317 | 1.21 | 1.234 | 3505 | 1.16 | 7.5 |
Table 1: System suitability parameters for Bempodic acid and Ezetimibe
| S. No. | Area of Bempedoic Acid | Area of Ezetimibe |
|---|---|---|
| 1. | 589021 | 51867 |
| 2. | 592900 | 52096 |
| 3. | 581184 | 52692 |
| 4. | 597966 | 53256 |
| 5. | 594888 | 54047 |
| 6. | 603378 | 53203 |
| Mean | 593223 | 52860 |
| SD | 7630.1 | 810.1 |
| %RSD | 1.3 | 1.5 |
Table 2: System precision of Bempedoic Acid and Ezetimibe
| S. No. | Area of Bempedoic Acid | Area of Ezetimibe |
|---|---|---|
| 1. | 595829 | 53945 |
| 2. | 596554 | 54063 |
| 3. | 589632 | 52959 |
| 4. | 602031 | 52392 |
| 5. | 591455 | 52845 |
| 6. | 586546 | 53248 |
| Mean | 593675 | 53242 |
| SD | 5565.0 | 652.5 |
| %RSD | 0.9 | 1.2 |
Table 3: Repeatability of Bempedoic Acid and Ezetimibe
| S. No. | Area of Bempedoic Acid | Area of Ezetimibe |
|---|---|---|
| 1. | 586376 | 49384 |
| 2. | 597962 | 49499 |
| 3. | 585664 | 49682 |
| 4. | 582891 | 48898 |
| 5. | 585647 | 49701 |
| 6. | 581281 | 48578 |
| Mean | 586637 | 49290 |
| SD | 5881.7 | 455.1 |
| %RSD | 1.0 | 0.9 |
Table 4: Intermediate precision of Bempedoic Acid and Ezetimibe
| S. No. | Bempedoic Acid | Ezetimibe | ||
|---|---|---|---|---|
| Conc (μg/mL) | Peak area | Conc (μg/mL) | Peak area | |
| 0 | 0 | 0 | 0 | |
| 22.5 | 148807 | 1.25 | 13614 | |
| 45 | 295902 | 2.5 | 27898 | |
| 67.5 | 461837 | 3.75 | 39344 | |
| 90 | 595929 | 5 | 52628 | |
| 112.5 | 747485 | 6.25 | 66254 | |
| 135 | 877477 | 7.5 | 79335 | |
Table 5: Linearity for Bempedoic Acid and Ezetimibe
| S. No. | Drug | % Level | Amount Spiked (μg/mL) | Amount recovered (μg/mL) | % Recovery | Mean %Recovery |
|---|---|---|---|---|---|---|
| 1. | Bempedoic Acid | 50% | 45 | 44.9 | 99.7 | 100.76 % |
| 45 | 45.0 | 100.1 | ||||
| 45 | 44.9 | 99.9 | ||||
| 100% | 90 | 90.2 | 100.2 | |||
| 90 | 89.6 | 99.6 | ||||
| 90 | 89.5 | 99.5 | ||||
| 150% | 135 | 135.8 | 100.6 | |||
| 135 | 136.0 | 100.8 | ||||
| 135 | 135.8 | 100.6 | ||||
| 2. | Ezetimibe | 50% | 2.5 | 2.52 | 101.00 | 100.40% |
| 2.5 | 2.49 | 99.78 | ||||
| 2.5 | 2.48 | 99.30 | ||||
| 100% | 5 | 5.06 | 101.15 | |||
| 5 | 5.00 | 100.08 | ||||
| 5 | 5.06 | 101.25 | ||||
| 150% | 7.5 | 7.58 | 101.13 | |||
| 7.5 | 7.59 | 101.25 | ||||
| 7.5 | 7.40 | 98.64 |
Table 6: Accuracy for Bempedoic Acid and Ezetimibe
| Molecule | LOD | LOQ |
|---|---|---|
| Bempedoic Acid | 0.77 | 2.34 |
| Ezetimibe | 0.09 | 0.28 |
Table 7: Sensitivity data for Bempedoic Acid and Ezetimibe
| Condition | %RSD of Bempedoic Acid | %RSD of Ezetimibe |
|---|---|---|
| Flow rate (-) 0.8mL/min | 1.4 | 1.3 |
| Flow rate (+) 1.0mL/min | 0.9 | 1.8 |
| Mobile phase (-) 55B:45A | 0.7 | 1.2 |
| Mobile phase (+) 45B:55A | 0.7 | 0.7 |
| Temperature (-) 25°C | 1.1 | 0.8 |
| Temperature (+) 35°C | 0.6 | 0.9 |
Table 8: Robustness data for Bempedoic Acid and Ezetimibe
| S. No. | Bempodic Acid | Ezetimibe | ||||
|---|---|---|---|---|---|---|
| Standard Area | Sample area | % Assay | Standard Area | Sample area | % Assay | |
| 589021 | 595829 | 595829 | 1.217 | 3442 | 1.24 | |
| 592900 | 596554 | 596554 | 1.220 | 3213 | 1.24 | |
| 581184 | 589632 | 589632 | 1.232 | 3482 | 1.20 | |
| 597966 | 602031 | 602031 | 1.233 | 3747 | 1.15 | |
| 594888 | 591455 | 591455 | 1.234 | 3626 | 1.23 | |
| 603378 | 586546 | 586546 | 1.234 | 3505 | 1.16 | |
| Avg | 593223 | 593675 | 593675 | 52860 | 53242 | 100.62 |
| SD | 7630.1 | 5565.0 | 5565.0 | 810.1 | 652.5 | 1.23 |
| %RSD | 1.3 | 0.9 | 0.9 | 1.5 | 1.2 | 1.23 |
Table 9: Assay for Bempedoic Acid and Ezetimibe
| S. NO. | Drug | Degradation Condition | % Recover | % Drug Degraded |
|---|---|---|---|---|
| 1. | Bempedoic Acid | Acid | 93.82 | 6.18 |
| Alkali | 95.41 | 4.59 | ||
| Oxidation | 95.78 | 4.22 | ||
| Thermal | 97.16 | 2.84 | ||
| UV | 98.32 | 1.68 | ||
| Water | 99.33 | 0.67 | ||
| 2. | Ezetimibe | Acid | 94.07 | 5.93 |
| Alkali | 95.06 | 4.94 | ||
| Oxidation | 95.48 | 4.52 | ||
| Thermal | 96.91 | 3.09 | ||
| UV | 98.23 | 1.77 | ||
| Water | 99.18 | 0.82 |
Table 10: Degradation Data of Bempedoic Acid and Ezetimibe
Discussion
During method optimization, organic solvents were initially used as the mobile phase with water in varying composition. However, neither compound was detected. Then, buffer was used with organic solvent in different ratios and at varying pH with the SB C18 100 x 1.8 mm, 2 μm column. Finally, the method was found to be optimized with the conditions of mobile phase 0.01% OPA: Acetonitrile (60:40%, v/v), wavelength 226 nm, flow rate of 0.3 mL/ min, column temperature of 30°C, and sample volume of 2 μL. With this method, both active compounds, i.e., Bempadoic Acid and Ezetimibe eluted at 1.865 min and 1.234 min with a total run time of 5 min with good resolution and symmetry. Following method optimization, the method was validated as per ICH guidelines. The curve indicates that the correlation coefficient (r2) was superior with a value of 1.000 in the linear range of 22.5-135 μg/mL for Bempadoic Acid and 1.25-7.5 μg/mL for Ezetimibe. The lower limits of quantification and detection for Bempadoic Acid and Ezetimibe were found to be 2.34 μg/mL and 0.77 μg/mL and 0.28 μg/mL and 0.09 μg/mL, respectively. As per the results obtained in the method validation, there was no interference of the blank or carryover problem, even at the LOQ. Both the LOQ and LOD of this method were verified practically in the instrument with S/N ratio criteria. The results were found to be satisfactory. The method was applied to degraded samples to verify its usefulness within the shelf-life period (stability indicating nature). The method detected degradants successfully in all the degradation conditions.
Conclusion
Based on the results obtained in the current study, the developed method was very simple, sensitive, accurate, linear, and economical. for the simultaneous estimation of the Bempedoic Acid and Ezetimibe in Tablet dosage form. Retention time of Bempedoic Acid and Ezetimibe were found to be 1.865 and 1.234 min. Due to the short duration of the chromatographic program, more samples can be analyzed within a short period, which will be helpful in the industry at a time when multiple products are manufactured continuously. % RSD of the Bempedoic Acid and Ezetimibe were and found to be 1.5 and 1.3 respectively. % Recovery was obtained as 100.40% and 100.76% for Bempedoic Acid and Ezetimibe respectively. LOD, LOQ values obtained from regression equations of Bempedoic Acid and Ezetimibe were 0.77, 2.34 and 0.09, 0.28 μg/mL respectively. Regression equation of Bempedoic Acid is y=6555. x+4296, y=10515x+437.4 of Ezetimibe. Retention times were decreased and that run time was decreased. The method met all the predefined acceptance criteria.
Conflicts of Interest
No conflict of interest was declared by the authors. The authors alone are responsible for the content and writing of the paper.
References
- Bempedoic acid: Uses, interactions, mechanism of action
- Ezetimibe: Uses, interactions, mechanism of action-DrugBank
- F.H. Bayzeed, A.B. Khadernaick, A new validated RP-HPLC method for the analysis of Bempedoic acid and Ezetimibe in bulk drug samples, Int J Pharm Anal Res, 15 (2020), 248-252.
[Crossref] [Google Scholar] [PubMed] [ResearchGate]
- B.R. Rao, B.S. Venkateswarlu, V.V. Rao, Simultaneous estimation of bempedoic acid and ezetimibe by UPLC, Int J Res Pharm Sci, 23 (2020), 1747-1752.
[Crossref] [Google Scholar] [PubMed] [ResearchGate]
- B.A. Srikanth, N. Matrooshi, C. Clark, J. Rahmani, Bempedoic acid and ezetimibe for the treatment of hypercholesterolemia: A systematic review and meta-analysis of randomized phase ii/iii trials, Clin Drug Investig, 25 (2021), 19-28.
[Crossref] [Google Scholar] [Pubmed] [ResearchGate]
Copyright: © 2022 A Sai Datri, et al. This is an open access article distributed under the terms of the Creative Commons Attribution License, which permits unrestricted use, distribution, and reproduction in any medium, provided the original work is properly cited.

