Research Article - Journal of Drug and Alcohol Research ( 2022) Volume 11, Issue 8
Robust, Sensitive and Validated RP-HPLC Modus Operandi for the Quantitation of Fixed Dose Combination of Gatifloxacin and Flurbiprofen
K. Shankar1*, M. Ramayyappa2 and G. Raveendra Babu32Department of Pharmaceutical Analysis, Oxbridge College of Pharmacy, India
3Department of Pharmaceutical Analysis, QIS College of Pharmacy, India
K. Shankar, Pharmacy Department, CDSCO, India, Email: upendragudimitla@gmail.com
Received: 03-Aug-2022, Manuscript No. jdar-22-73051; Editor assigned: 05-Aug-2022, Pre QC No. jdar-22-73051 (PQ); Reviewed: 19-Aug-2022, QC No. jdar-22-73051; Revised: 24-Aug-2022, Manuscript No. jdar-22-73051 (R); Published: 31-Aug-2022, DOI: 10.4303/jdar/236193
Abstract
In this study, we aim to create a technique for the simultaneous determination of stability indicators of Gatifloxacin (GTF) and Flurbiprofen sodium (FLU) using reversed phase high performance liquid chromatography in ophthalmic dosage form that is easy to perform and replicate with high reliability. For the RP-HPLC analysis, a thermosil C18 column (4.6 x 250 mm, 5 μm) is used with a mobile phase comprising of 0.02 M phosphate buffer: acetonitrile (70:30) at a velocity of 1.0 ml/min. The 236 nm wavelength was used for the detection. GTF and FLU were shown to have retention durations of 2.152 min and 7.881 min, respectively. It was determined that the linearity ranges for GTF and FLU were 20-60 μg/ml and 2-6 μg/ml, respectively. For marketed formulation, both GTF and FLU had recoveries of 98.73 and 99.21 percent, respectively. Results showed that the medications had correlation coefficients greater than 0.99. Acceptance was also achieved with respect to other aspects such as ruggedness, robustness, etc. The RP-HPLC methods for showing stability were found to be reliable, quick, exact, and easy to use. Using this simple technique, the selected medicaments in bulk and ophthalmic dose forms can be estimated simultaneously.
Keywords
Gatifloxacin; Flurbiprofen sodium; Validation; RP-HPLC
Introduction
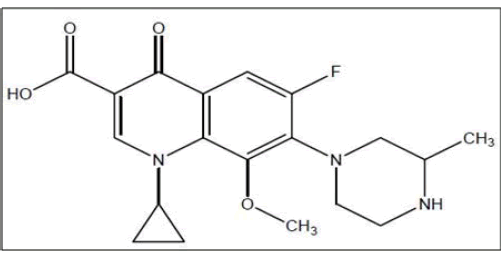
1-cyclopropyl-6-fluoro-8-methoxy-7-(3-methylpiperazin- 1-yl)-4-oxo-1,4-dihydroquinoline-3-carboxylic acid is the chemical name for gatifloxacin (Figure 1). It is a fluoroquinolone antibiotic that blocks the replication of bacterial DNA by obstructing the mediator’s topoisomerase IV and DNA gyrase. Infections of the respiratory system are its primary target [1].
Figure 1: Chemical Structure of Gatifloxacin
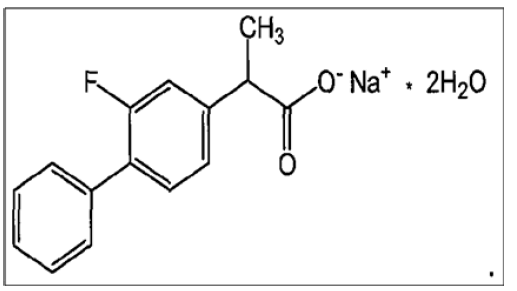
Figure 2 shows the chemical structure of FLU, also known as 2-(3-fluoro-4-phenylphenyl) propanoic acid, which is an NSAID with antipyretic and analgesic properties. Symptomatic therapy of anklylosing spondylitis, osteoarthritis and rheumatoid arthritis with oral flurbiprofen is possible [2].
Figure 2: Chemical Structure of Flurbiprofen sodium
In depth research into the published literature revealed that UV-Spectrophotometric [3-6], Spectrofluorometric [7], HPTLC [8,9], LC-MS [10,11], and HPLC [12-15] methods are available for the assessment of these medications singly or in combination. We aimed to create straightforward spectrophotometric and RP-HPLC procedures for the combined assessment of these medicines. The procedures proposed were verified as valid in accordance with ICH regulations [16]. Under stress, pharmacological compounds were degraded forcibly using the RP-HPLC technique in order to establish the stability indicating [17] nature of the technique (different conditions for forced degradation studies). The proposed procedures were fine-tuned and verified in accordance with ICH standards.
Materials and Methods
Chemicals and reagents
Yarrow Chemicals Ltd., Mumbai was contacted to acquire working standards of flurbiprofen sodium and gatifloxacin. The FLUBIGAT eye drops were acquired from a local pharmacy and are available for commercial use. Merck specialties Pvt. Ltd., Mumbai supplied the HPLC grade acetonitrile and methanol. Milli-Q System double-distilled water was utilised in all studies (Millipore). Universal Laboratories Pvt. Ltd., Mumbai supplied the 30% AR grade hydrogen peroxide, while Merck Specialties Pvt. Ltd., Mumbai supplied the concentrated hydrochloric acid and purified sodium hydroxide pellets.
Instrumentation and analytical conditions
The absorbance of solutions was determined using a Double beam LABINDIA UV-Visible spectrophotometer, 3092, with a spectral bandwidth of 2 nm and wavelength accuracy of 0.5 nm, and a set of matching quartz cells of 1 cm in diameter. The RP-HPLC technique was carried out utilising a binary gradient pump HPLC system (Shimadzu) and a UV detector (LC-AD20) for analysis. Lab solutions software was used to collect chromatographic data. We used a Thermosil C18 column (4.6 mm i.d., 250 mm) as our stationary phase to accomplish this separation. To isocratically elute GTF and FLU, a mobile phase of 0.02 M phosphate buffer: acetonitrile (70:30 v/v) was used at a flow rate of 1.0 mL/min. Adjusting the UV detector’s setting to 236 nm (Figures 3 and 4). The mobile phase was filtered using a 0.45 m membrane filter after being sonicated before each use (Millipore). In, we saw a rundown of the main criteria for judging a system’s fitness for use (Table 1).
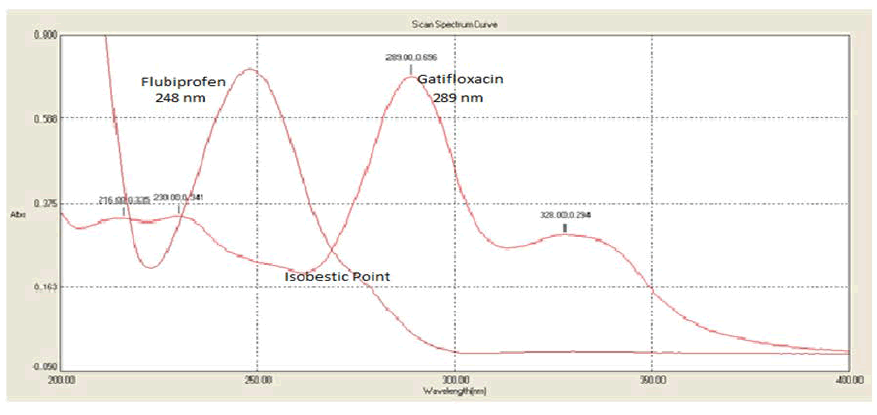
Figure 3: Overlain spectrum of Gatifloxacin and Flurbiprofen sodium
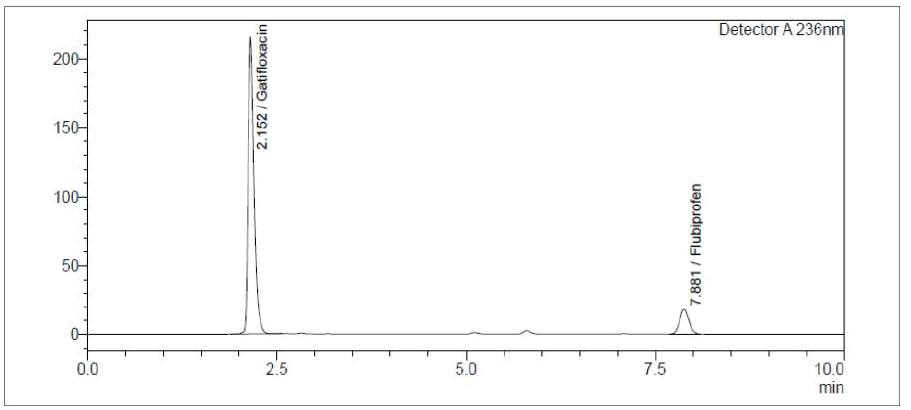
Figure 4: Chromatogram showing well resolved peaks of Gatifloxacin and Flurbiprofen
| Parameter | Observation* | |
|---|---|---|
| GTF | FLU | |
| Retention time | 2.152 min. | 7.881 min. |
| No. of Theoretical plates | 6534 | 5985 |
| Tailing Factor | 1.181 | 1.064 |
| Average of six readings | ||
Table 1: RP-HPLC System suitability parameters
Preparation of standard solutions
A standard solution of GTF (100 μg/ml) and FLU (100 μg/ ml) was prepared by adding accurately weighed quantities of GTF (10 mg) and FLU (10 mg) to separate 100 mL volumetric flasks, dissolving them in a solvent comprising acetonitrile: water in the ratio of 70:30 v/v, and diluting them to the mark. A 10 ml volumetric flask was used to create standard stock solutions of 40 μg/ml GTF and 4 μg/ ml FLU by diluting the corresponding stock solutions with the mobile phase.
Preparation of the sample solutions
Sample (FLUBIGAT Eye drops) included 0.3% (w/v) Gatifloxacin and 0.03% (w/v) Flurbiprofen, which is in compliance with the labelling. By adding 1 ml of the formulation to a 50 ml volumetric flask and diluting it to the necessary amount using a solvent consisting of acetonitrile: water in the ratio of 30:70 v/v, we were able to reach concentrations of 60 μg/ml GTF and 6 μg/ml FLU. After transferring 5 ml of the solution to a 10 ml volumetric flask, the volume was diluted to 10 ml to achieve a final concentration of 30 μg/ ml of GTF and 3 μg/ml of FLU.
Procedure for forced degradation study
For the degradation tests, solutions with 30 μg/ml of GTF and 3 μg/ml of FLU were used.
Stress degradation by hydrolysis under acidic conditions
The final drug solution was refluxed for 1 hour at 60° C after 1 mL of 2M HCl was added to it. This solution was then injected after 1 hour at room temperature and under ideal chromatographic conditions.
Stress degradation by hydrolysis under alkaline conditions
After adding 1 mL of 2M NaOH to the final drug solution and refluxing it for 1 hour at 60° C, the medication was degraded by the alkali. This solution was then injected after 1 hour at room temperature and under ideal chromatographic conditions.
Oxidative degradation
The finished drug solution was refluxed for 1 hour at 60° C after 1 mL of 10% v/v H2O2 was added. After waiting 1 hour, optimum chromatographic conditions allowed for the injection of this solution.
Photo hydrolysis
The finished medication solution underwent photolytic testing by being stored at room temperature and subjected to UV light at 200 watt hours/m2 for 7 days. Under ideal chromatographic conditions, this solution was injected after 7 days.
Thermal hydrolysis
The final drug solution was kept at 60 degrees Celsius for six hours for thermal studies. Under ideal chromatographic conditions, this solution was injected after 6 hours.
Neutral hydrolysis
A one hour period of refluxing at 60 degrees Celsius is used to achieve the desired drug concentration in Neutral Hydrolysis. This solution was then injected after 1 hour at room temperature and under ideal chromatographic conditions.
Method validation
International Conference on Harmonization criteria for validation of analytical processes were used to verify the accuracy of the established methodologies.
Linearity
GTF and FLU RP-HPLC calibration curves at 2-6 μg/ml and 20-60 μg/ml, respectively. There were three copies of each solution made. Regression analysis, with the least squares regression approach used to determine linearity, was performed.
Precision
Analyses of the samples (at 50%, 100%, and 150% concentrations) were performed at three separate times during a single day (intraday precision) and on separate days (interday precision).
Accuracy
Recovery studies were conducted in triplicate using the standard addition method at the 80%, 100%, and 120% levels to evaluate the precision of the RP-HPLC method.
Robustness
We tested the RP-HPLC method’s robustness by analysing materials under varying chromatographic settings. After starting with a mobile phase flow rate of 1 ml/min, we subsequently adjusted it to 0.9 ml/min and then 1.1 ml/min. There was a 5% variation in the organic phase ratios, therefore 25% and 35% acetonitrile were used instead. There was an investigation into how this affected the retention time and peak parameter.
Limit of detection and limit of quantitation
The limits of detection and quantification (LOD, LOQ) for the RP-HPLC technique were determined by utilising the slope and intercept values of the calibration curves for both drugs.
Result and Discussion
The mobile phase was determined by experimenting with various mixtures of acetonitrile and water. Finally, the mobile phase was settled upon as a 70:30 (v/v) mixture of 0.02 M phosphate buffer and acetonitrile. The standard solution of GTF and FLU was analysed using the suggested approach, and the resulting chromatogram is shown in Figure 4. The elution sequence at a flow rate of 1.0 ml/min was GTF (Rt=2.152 min) followed by FLU (Rt=7.881). At 236 nm, the chromatogram was captured.
We produced calibration curves for GTF and FLU over the concentration range of 2-6 g/ml and 20-60 g/ml, respectively, and found that the coefficient of regression for both medications was closer to 1 than to 0.99 (Table 2).
| Method | Parameter | GTF | FLU |
|---|---|---|---|
| HPLC | Regression equation | Y=55546x | Y=94224x-1529 |
| Linearity (µg/ml) | 20-60 | 2-6 | |
| Correlation coefficient | 0.999 | 0.999 |
Table 2: Linearity values of Gatifloxacin and Flurbiprofen sodium
It was found that the proposed method was accurate (Table 3), meaning that the calculated value was in line with the target value.
| Drug | Recovery | % RSD | ||||
|---|---|---|---|---|---|---|
| 80 % | 100 % | 120 % | 80 % | 100 % | 120 % | |
| GTF | 98.52 | 99.60 | 99.14 | 0.08 | 0.12 | 0.94 |
| FLU | 98.24 | 99.04 | 101.03 | 0.04 | 0.88 | 0.59 |
Table 3: Recovery values of Gatifloxacin and Flurbiprofen sodium
The accuracy of both medications was measured by comparing the daily and hourly shifts in their concentrations. Estimation of GTF and FLU during intraday and interday changes was shown to have relative standard deviations of less than 2 (Table 4). Slope and intercept values from the calibration curves were used to determine the LOD and LOQ for each drug (Table 5), and it was observed that the percent relative standard deviations for robustness studies in all purposefully altered settings were less than 2% (Table 6). The results of the experiments performed on the ophthalmic formulation to determine GTF and FLU were within the specified ranges (Table 7).
| Drug | Concentration (µg/ml) |
Intraday (% RSD) |
Interday (% RSD) |
System Precison(% RSD) |
|---|---|---|---|---|
| Gatifloxacin | 20 | 0.22 | 0.92 | 1.01 |
| 40 | 0.30 | 0.57 | ||
| 60 | 0.37 | 0.42 | ||
| Flurbiprofen | 2 | 0.21 | 0.21 | 0.34 |
| 4 | 0.66 | 0.28 | ||
| 6 | 0.16 | 1.4 |
Table 4: Precision values of Gatifloxacin and Flurbiprofen sodium
| Drug | LOD (µg/ml) | LOQ (µg/ml) |
|---|---|---|
| GTF | 0.09 | 2.70 |
| FLU | 0.06 | 0.20 |
Table 5: LOD and LOQ of Gatifloxacin and Flurbiprofen sodium
| S. No. | Parameter | % Target conc. |
GTF | FLU |
|---|---|---|---|---|
| Rt (min.) | Rt (min.) | |||
| 1 | Initial Sample | 50 % | 2.174 | 7.769 |
| 100 % | 2.177 | 7.751 | ||
| 150 % | 2.169 | 7.741 | ||
| 2 | Flow 0.9 ml/min | 50 % | 2.365 | 8.235 |
| 100 % | 2.370 | 8.242 | ||
| 150 % | 2.370 | 8.237 | ||
| 3 | Flow 1.1 ml/min | 50 % | 1.948 | 7.315 |
| 100 % | 1.958 | 7.326 | ||
| 150 % | 1.964 | 7.398 | ||
| 4 | Organic phase, 10 % more (35%) | 50 % | 2.055 | 6.594 |
| 100 % | 2.056 | 6.612 | ||
| 150 % | 2.080 | 6.629 | ||
| 5 | Organic phase, 10 % less (25 %) | 50 % | 2.241 | 8.168 |
| 100 % | 2.248 | 8.204 | ||
| 150 % | 2.259 | 8.215 |
Table 6: Robustness parameters of GAT and FLU
| Drug | Amount labeled | Amount found | % Label claim | % RSD |
|---|---|---|---|---|
| GTF | 3 mg/ml | 3.012 | 100.40 | 0.38 |
| FLU | 0.3 mg/ml | 0.299 | 99.66 | 0.50 |
Table 7: Assay data of marketed formulation
In an acidic environment, hydrolysis of GTF and FLU led to the degradation findings displayed in Figure 5.
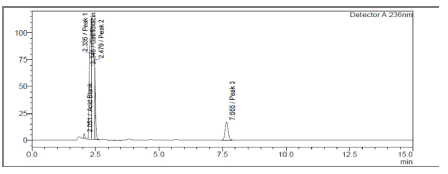
Figure 5: Chromatogram of GAT and FLU in 2M HCL
Both medicines were shown to be destroyed by alkaline hydrolysis, as demonstrated in Figure 6. Gatifloxacin degraded in the presence of hydrogen peroxide (3%), whereas Flurbiprofen remained stable (Figure 7). Poor Stability Under Photolytic Conditions; Neither drugs was significantly degraded by light exposure displayed in Figure 8. Hydrolysis at high temperatures: Gatifloxacin Degrades, Flurbiprofen Stays Stable (Figure 9). Both medicines demonstrated negligible photodegradation when exposed to neutral hydrolysis and is manifested in Figure 10.
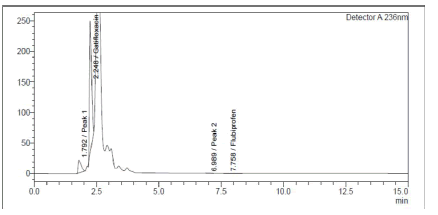
Figure 6: Chromatogram of GTF and FLU in 2M NAOH
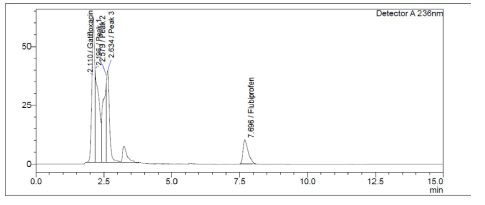
Figure 7: Chromatogram of GTF and FLU in 10% H202
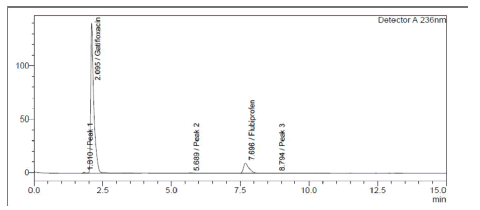
Figure 8: Chromatogram of GTF and FLU in UV photolytic condition
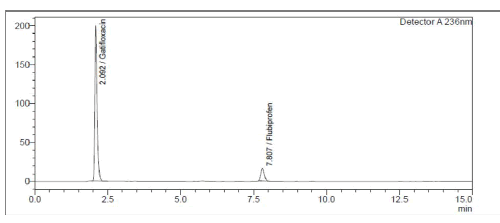
Figure 10: Chromatogram of GTF and FLU in neutral stress condition
Degradation studies reveal the percentage of medication lost to degradation, and the Rt of degradation products are listed here Table 8.
| Drug | Stress Condition (% degradation) | |||||
|---|---|---|---|---|---|---|
| Acid | Base | Peroxide | UV | Thermal | Neutral | |
| GTF | 67.70 | 82.90 | 40.87 | 2.37 | 48.69 | 0.36 |
| FLU | 6.87 | 87.85 | 7.06 | 2.06 | 0.15 | 0.88 |
Table 8: Degradation data of stress studies
Conclusion
The RP-HPLC method was designed to be quick, sensitive, and easy to use, and it was verified against ICH standards. When compared to other approaches, the proposed ones have a low standard deviation and % RSD, indicating a high degree of precision. It has been shown through extensive recovery study findings that the proposed approaches are highly accurate. In spite of the presence of its degradation products, the RP-HPLC method was able to selectively quantify GTF and FLU, allowing it to be used as a stability indicating technique. Results from the experiments show that the spectrophotometric and stability indicating chromatographic methods devised are reliable, precise, and selective, and may be used for the determination of GTF and FLU in ocular dose form.
Conflict of Interest
The authors have no conflicts of interest regarding this investigation.
Acknowledgment
None.
Source of Funding
None.
References
- Data base of gatifloxacin, compilation prepared by drug bank.
- Data base of Flurbiprofen, compilation prepared by drug bank.
- G. Patel, P. Chauhan, S. Shah, Simultaneous estimation of gatifloxacin and flurbiprofen sodium in ophthalmic formulation by uv-specrophotometric method, J Chem Pharm Res, 6(2014), 96-101.
- N. Upadhyay, R.K. Maheshwari, J. Jain, M. Patani, R. Pandey, New spectrophotometric analysis of gatifloxacin tablets utilizing mixed solvency concept, Der Pharmacia Lettre, 4(2012), 1-4.
- A.A. Shalaby, R.A. Sayed, W.S. Hassan, M.Y. El-mammli, A new extractive spectrophotometric method for the determination of gatifloxacin and cefotaxime sodium in pure and pharmaceutical dosage forms, Orien J Chem, 28(2012), 639-650.
- P.K. Pradhan, P.N. Rajput, N. Kumar, B. Joshi, U.M. Upadhyay, Simultaneous estimation of flurbiprofen and gatifloxacin by dual wavelength uv spectroscopy method in an eye drops , Int J Pharm Sci Rev Res, 27(2014), 96-99.
- M.D. Jinal, M.P. Vishnu, P. Rajesh, S. Dushyant, Development and validation of spectrofluorometric method for analysis of gatifloxacin and flurbiprofen sodium in ophthalmic dosage form, Inv Rap Pharm Anal Qty Ass, 2(2014), 160-168.
- A.R. Rote, P.A. Kumbhoje, Development and validation of hptlc method for simultaneous estimation of gatifloxacin and ornidazole in human plasma, J Chrom sep tech, 2(2011), 2157-7064.
- S.A. Shah, I.S. Rathod, B.N. Suhagia, M. Baldaniya, A simple and sensitive hptlc method for estimation of gatifloxacin in tablet dosage forms, Ind J Pharm Sci, 66(2004), 306-308.
- A. Giancarlo, C. Marina, O. Marica, M.F. Roberto, L.W. Gary, Metabolic profile of no-flurbiprofen in rat brain and plasma: A lc-ms study, Life Sci, 71(2002), 1487-1500.
- J. Deglon, A. thomas, Y. daali, E. lauer, C. samer, et al. Automated system for on-line desorption of dried blood spots applied to LC/MS/MS pharmacokinetic study of flurbiprofen and its metabolite, J Pharm Biomed Anal, 54(2011), 359-367.
- S. Sridhar, R. Kavitha, M. Sudhakar. Reverse phase high performance liquid chromatography method development and validation for the simultaneous estimation of gatifloxacin and flurbiprofen in pharmaceutical dosage form,Asian J Pharm Clin Res, 8(2015), 242-246.
- R.R. Sandip, M.P. Laxman, A.K. Joshi, K.L. Mahammadali, RP-HPLC method for the simultaneous estimation of gatifloxacin and flurbiprofen sodium in their ophthalmic dosage form,Int J Univ Pharm Bio Sci, 3(2014), 59-70.
- K.R. Sireesha, K. Prakash, Simultaneous determination of gatifloxacin and dexamethasone sodium phosphate in bulk and pharmaceutical formulations by hplc, Afr J Pharm Pharmac, 5(2011), 1990-1995.
- N. Sultana, M. Arayne, R. Siddiqui, S. Naveed, RP-HPLC method for the simultaneous determination of lisinopril and nsaids in api, pharmaceutical formulations and human serum, Ame J Ana Chem, 3(2012), 147-152.
- ICH guidelines Q2 (R1), text on validation of analytical procedures, methodology international conference on harmonization, Geneva.
- International Conference on Harmonization (ICH) Harmonized Tripartite Guideline on, Topic Q1A, Notes for Guidance on stability testing: Stability testing of new drug substances and new drug products.
Copyright: © 2022 K. Shankar, et al. This is an open access article distributed under the terms of the Creative Commons Attribution License, which permits unrestricted use, distribution, and reproduction in any medium, provided the original work is properly cited.

