Research Article: Journal of Drug and Alcohol Research (2022) Volume 11, Issue 9
RP-HPLC Method of Drug Development and Validation for the Determination of Ezetimibe using Design of Experiments Approach
A. Sai Datri1*, K. S. Nataraj2 and A. Lakshmana Rao32Department of Pharmaceutical Sciences, Shri Vishnu College of Pharmacy, India
3Department of Pharmaceutical Sciences, V. V. Institute of Pharmaceutical Sciences, India
A. Sai Datri, Department of Pharmaceutical Sciences, Andhra University College of Pharmaceutical Sciences, India, Email: sai.dhatri_arige@yahoo.co.in
Received: 31-Aug-2022, Manuscript No. jdar-22-77994; Editor assigned: 02-Sep-2022, Pre QC No. jdar-22-77994 (PQ); Reviewed: 16-Sep-2022, QC No. jdar-22-77994; Revised: 21-Sep-2022, Manuscript No. jdar-22-77994 (R); Published: 28-Sep-2022, DOI: 10.4303/jdar/236198
Abstract
The present research aims to develop and validate a simple and accurate RP-HPLC method for the determination of Ezetimibe by using the Design of Experiments Approach. This approach was useful for multivariate optimization of the method. The critical method parameters (CMPs) were optimized using the Box-Behnken design. Minitab software was equipped for the study. Chromatographic separation was done on Phenomenex C18 column with specifications 150 mm × 4.6 mm × 5 μm at 30°C. The predicted and optimized data from the software consisted of mobile phase 0.02 N Ortho phosphoric acid (OPA) and Acetonitrile (53:47% v/v), pumped at a flow rate of 0.96 ml/min brought the desirability function of 1. The UV detector was adjusted at 232.6 nm. The developed method was shows linearity with a correlation coefficient of 0.999. The optimized chromatographic method was validated as per the guidelines of ICH Q2 (R1). The stability of drug was forcibly studied under different stress conditions.
Keywords
Ezetimibe; Design of Experiments Approach; Box-Behnken design; ICH Q2 (R1).
Introduction
Ezetimibe [1,2] is marked under the brand name Zetiheal, which is approved for the management of hypercholestrerolemia. Generally, this drug decreases the absorption of cholesterol and phytosterol via small intestine without disturbing the absorption of fat-soluble vitamins and minerals by that means it lowers blood cholesterol levels. The IUPAC name of the compound is (3R,4S)-1-(4-fluorophenyl)- 3-[(3S)-3-(4-fluorophenyl)-3-hydroxypropyl]-4- (4-hydroxyphenyl)azetidin-2-one and the chemical structure of the compound is shown in Figure 1. After detailed literature review of Ezetimibe, a few methods are reported based on a variety of techniques such as UV-spectroscopy, Liquid chromatographic-tandem mass spectrometric (LC-MS/MS) methods and HPLC Methods [3-5]. None of the reported analytical methods describes a simple HPLC method for studying the effect of stress on pharmaceutical dosage forms of Ezetimibe. Hence the present work was focused on the development and validation of the estimation of Ezetimibe by Analytical Quality by Design (AQbD) approach with the help of Minitab software. This approach helps in understanding the empirical relationship between one or more measured responses and several independent variables in the form of a polynomial equation. Mapping of those responses related to the experimental domain helps in developing an optimized method. Optimization of the method for the present research was performed with the help of the Box-Behnken design.
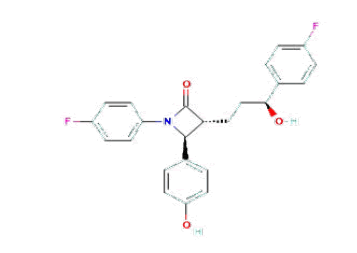
Figure 1: Chemical structure of Ezetimibe
Materials and Methods
Ezetimibe is obtained from Spectrum Labs. Phosphate buffer, Acetonitrile, Potassium dihydrogen orthophosphate buffer, Methanol, and ortho phosphoric acid are brought from Rankem. The formulation Zetiheal (Ezetimibe 10 mg) was purchased from the local market. Water HPLC 2695 system with photodiode array detector integrated with Empower 2 software is used for HPLC study. Minitab 21.2.0.0 was aided for the production of 2D contour plots and 3D surface plots.
Preparation of stock, standard and test solutions
Stock solution 100 μg/ml of Ezetimibe reference standard was prepared by transferring 10 mg, accurately weighed drug, into a 100 ml volumetric flask and adding 20 ml 0.02 N ortho phosphoric acid:acetonitrile (53:47% v/v). The mixture was sonicated for about 2 minutes to dissolve the Ezetimibe and then the solution was diluted to volume with the same solvent mixture. A standard solution of 10 μg/ml was prepared by diluting 1 ml standard stock solution to 10 ml, in a volumetric flask, with the same solvent mixture. To make stock solution 100 μg/ml for assay, 20 tablets were weighed and mixed. An aliquot of powder equivalent to the weight of 10 mg was accurately weighed and transferred to 100 ml volumetric flask. Add 20 ml of 0.02 N ortho phosphoric acid:acetonitrile (53:47% v/v) to the flask and the mixture was sonicated for 10 minutes in a sonicator. The contents of the flask were then diluted to the volume with the same solvent mixture. This solution (10 ml) was filtered through a nylon syringe filter of 0.45 μm. To make test solution (10 μg/ml) for assay, take 1 ml test stock solution into 10 ml volumetric flask and diluted to volume with 0.02 N ortho phosphoric acid:acetonitrile (53:47% v/v).
Initial chromatographic conditions screening
For initial chromatographic conditions selection like organic modifier, organic phase, and flow rate, a 23 Factorial design consisting of 3 factors at 2 levels was selected [6]. The selected 23 factorial design results in 8 trial runs suggest various combinations for the factors chosen.
Optimization of the method by response surface methodology
Many response surface design models are used for the optimization of methods like Central composite, Doehlert, and Box–Behnken. Among all the Box-Behnken Design is superior because it requires lesser test runs, is rotatable, and does not contain any outliers of the cubic region. In the current investigation, the Box-Bohnken design was used for the method optimization of Ezetimibe by RP-HPLC because the design provides three levels for each factor and requires lesser runs in the three-factor case than the Central composite and Doehlert design [7].
Method validation
The validation of the final optimized analytical method was performed as per ICH Q2 (R1) guidelines8 for specificity, system suitability, linearity, accuracy, precision, the limit of detection, the limit of Quantitation and robustness.
Forced degradation studies
The drug was subjected to various stress conditions as mentioned in ICH Q1A (R2) guidelines to understand whether the developed method was stability indicating.
Results and Discussion
Analytical QbD-assisted method development
Initial chromatographic conditions screening: A 23 Factorial design comprising three factors at two levels was selected for the experimental plan initially to select the appropriate percent of organic content in the mobile phase, organic modifier, and flow rate which majorly affect the selectivity. The percent of organic content of the mobile phase was chosen between 30-50, Methanol and Acetonitrile were chosen as organic solvents since they were most commonly used in RP-HPLC. The flow rate is adjusted between 0.8 to 1. Likewise, the factors and the levels selected for the screening design were shown in Table 1. The selected 23 factorial designs resulted in [8] trial runs signifying various combinations for the factors chosen were presented in Table 2. The responses selected were retention time, theoretical plates, and asymmetry [9,10].
| Factors | Levels |
|---|---|
| % Organic content of the mobile phase | 30/50 |
| Organic Modifiers | Methanol/Acetonitrile |
| Flow Rate | 0.8/1 |
Table 1: Factors and levels chosen for 23 factorial design of Ezetimibe
| Run Order | % Organic Composition | Flow Rate | Organic Modifier | Retention Time | Theoretical Plates | Asymmetry |
|---|---|---|---|---|---|---|
| 1 | 30 | 0.8 | ACN | 2.289 | 8647 | 1.2 |
| 2 | 30 | 0.8 | Methanol | 2.457 | 7988 | 1.2 |
| 3 | 50 | 1 | ACN | 2.247 | 8784 | 1.1 |
| 4 | 50 | 0.8 | Methanol | 2.468 | 7968 | 1.0 |
| 5 | 30 | 1 | Methanol | 2.472 | 8123 | 1.2 |
| 6 | 30 | 1 | ACN | 2.291 | 8562 | 1.2 |
| 7 | 50 | 0.8 | ACN | 2.325 | 8216 | 1.1 |
| 8 | 50 | 1 | Methanol | 2.321 | 8869 | 1.2 |
Table 2: Trial runs of 23 factorial design with responses
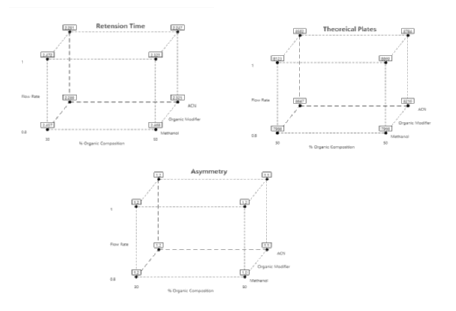
Statistical analysis of 23 factorial design experimental data by Minitab software: Analysis of variance (ANOVA) was applied to study the significance of the model shown in Table 3. From the table, it is seen that the Model F-values of 4521.60, 549.69, and 15.45 for retention time, theoretical plate, and asymmetry respectively imply the model is significant. Values of P<0.05 A, B, and C are significant model terms for asymmetry with P<0.05. The significance of the terms A, B, and C indicates that the initial chromatographic conditions selected have a greater influence on the responses. The responses obtained were feedback to the Minitab software and the cube plots for retention time, theoretical plates, and asymmetry was drawn as shown in Figure 2. From the 23 factorial designs, based on the cube plots for the responses the initial chromatographic conditions selected for further study were acetonitrile, 47% organic content, and 0.96 flow rate at which retention time is less, theoretical plates are more and asymmetry is less.
| ANOVA for selected Factorial model | |||||||
|---|---|---|---|---|---|---|---|
| Analysis of variance (Type-III of the Partial sum of squares) | |||||||
| Response | Source | Sum of squares | df | Mean square | F value | p value | Inference |
| Retention Time | Model | 23.71 | 4 | 5.71 | 4521.60 | <0.0001 | Significant |
| A-OP | 0.023 | 1 | 0.023 | 18.21 | 0.021 | ||
| B-FR | 1.81 | 1 | 1.81 | 1403.19 | <0.0001 | ||
| C-OM | 20.15 | 1 | 20.15 | 15380.46 | <0.0001 | ||
| AB | 1.70 | 1 | 1.70 | 1301.21 | <0.0001 | ||
| Residual | 3.932E-001 | 3 | 1.311E-001 | ||||
| Theoretical Plates | Model | 8.221E+005 | 4 | 2.055E+007 | 549.69 | <0.0001 | Significant |
| A-OP | 5.956E+003 | 1 | 5.957E+006 | 159.61 | 0.001 | ||
| B-FR | 5.781E+003 | 1 | 5.781E+006 | 154.93 | 0.001 | ||
| C-OM | 6.715E+005 | 1 | 6.715E+007 | 1799.55 | <0.0001 | ||
| AB | 3.321E+005 | 1 | 3.321E+006 | 88.91 | 0.002 | ||
| Residual | 1.121E+003 | 3 | 37322.1 | ||||
| Asymmetry | Model | 0.35 | 3 | 0.11 | 15.45 | 0.010 | Significant |
| A-OP | 0.081 | 1 | 0.080 | 11.12 | 0.027 | ||
| B-FR | 0.083 | 1 | 0.085 | 11.71 | 0.023 | ||
| C-OM | 0.21 | 1 | 0.21 | 26.51 | 0.005 | ||
| Residual | 0.027 | 4 | 7.362E-001 | ||||
| df - Degree of Freedom, OP – Organic Phase, FR – Flow Rate, and OM – Organic Modifier | |||||||
Table 3: ANOVA for the responses by 23 factorial model
Figure 2: Cube plots of Retention Time, Theoretical Plate and Asymmetry for 23 Factorial design
Optimization by Box-Behnken design
AQbD method encompasses identifying Critical method parameters (CMP) and Critical quality attributes (CQA) with risk assessment and producing design space. In the present study Critical Method Parameters selected were the percentage of organic content in the mobile phase, organic modifier and flow rate. The CQA’s selected were retention time, theoretical plates and asymmetry. So, Box-Behnken Design was used to optimize these parameters which were varied over three level (high, mid and low)10. Different ranges of three parameters 30%-50% organic phase, organic modifiers–Acetonitrile/methanol and flow rate of 0.8-1.0 ml/min were considered. A 3-factor 3-level Box Behnken Design was developed [11]. This study design of 17 experimental runs was generated and analyzed by Minitab software as shown in Table 4.
| Trail No | Run Order | % Organic Composition | Flow Rate | Organic Modifier | Retention Time | Theoretical Plates | Asymmetry |
|---|---|---|---|---|---|---|---|
| 5 | 1 | 30 | 0.8 | ACN | 2.289 | 8647 | 1.2 |
| 7 | 2 | 30 | 1 | ACN | 2.291 | 8562 | 1.2 |
| 10 | 3 | 40 | 0.8 | Methanol | 2.457 | 7988 | 1.2 |
| 17 | 4 | 40 | 0.9 | ACN | 2.290 | 8754 | 1.0 |
| 4 | 5 | 50 | 0.9 | Methanol | 2.319 | 8769 | 1.1 |
| 16 | 6 | 40 | 0.9 | ACN | 2.290 | 8754 | 1.0 |
| 12 | 7 | 40 | 1 | Methanol | 2.318 | 8669 | 1.0 |
| 13 | 8 | 40 | 0.9 | ACN | 2.290 | 8754 | 1.1 |
| 15 | 9 | 40 | 0.9 | ACN | 2.290 | 8754 | 1.1 |
| 11 | 10 | 40 | 1 | Methanol | 2.318 | 8669 | 1.0 |
| 3 | 11 | 30 | 0.9 | Methanol | 2.321 | 8869 | 1.2 |
| 14 | 12 | 40 | 0.9 | ACN | 2.290 | 8754 | 1.0 |
| 8 | 13 | 50 | 1 | Methanol | 2.321 | 8869 | 1.2 |
| 9 | 14 | 40 | 0.8 | Methanol | 2.310 | 8569 | 1.2 |
| 1 | 15 | 30 | 0.9 | Methanol | 2.321 | 8869 | 1.2 |
| 6 | 16 | 50 | 0.8 | ACN | 2.325 | 8216 | 1.1 |
| 2 | 17 | 50 | 0.9 | Methanol | 2.319 | 8769 | 1.1 |
Table 4: Box-Behnken design with responses
Statistical analysis of experimental data by Minitab software
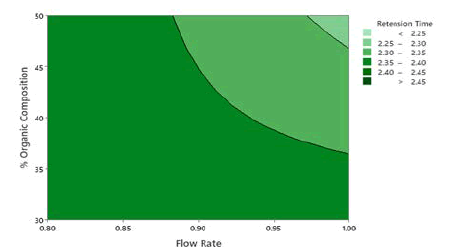
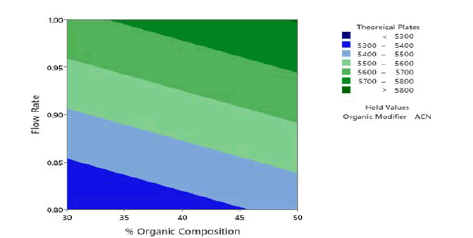
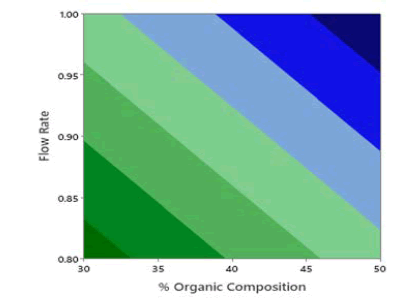
Application of the ANOVA was done to study the significance of the model for the 3 responses which is given in Table 5. The retention time, the Model F-value of 67.13 indicates the model is significant. There are only 0.01% conditions that an F-value this large could happen due to noise. P values less than 0.0500 show model terms are significant. In this case, A, B, and C are the significant model terms. 2D Contour plots were studied to visualize the effect of factors and their interactions on the responses using the Minitab software. In the 2D Contour plots of retention time shown in Figure 3, it was found that at middle organic phase content, higher flow rate and acetonitrile as an organic modifier have less retention time. From the ANOVA data for theoretical plates shown in Table 6, the Model F-value of 2.59 suggests the model is not significant and there is a 9.5% chance that an F-value was large happen due to noise. In this case, only A is a significant model term. In the screening studies, at acetonitrile theoretical plates are more when compared to methanol and the model was found to be significant. Hence acetonitrile was selected for optimization study. To study the effect of significant term on Theoretical Plates, a 2D contour plot was analyzed using Minitab software from the 2D Contour plot of theoretical plates shown in Figure 4, it was found that at a higher organic phase content, flow rate and acetonitrile of theoretical plates is more. From the ANOVA for the asymmetry shown in Table 7, the Model F-value of 5.31 implies the model is significant. There is only a 1.89% chance that an F-value this large could occur due to noise. P values less than 0.0500 indicate model terms are significant. In this case, AB and C2 are significant model terms. To study the effect of significant terms AB and C2 on asymmetry, a 2D contour plot was analyzed using Minitab software. From the above 2D Contour plot of asymmetry shown in Figure 5, it was found that at a higher organic phase content and acetonitrile the value of asymmetry is less. From the fit statistical parameters found from ANOVA, it was obtained that the predicted R² value of retention time 0.8909 is in realistic agreement with the adjusted R² 0.9274 i.e., the difference is less than 0.2. A negative predicted R² value of tailing factor-0.9613 suggests that the overall mean may be a better predictor of the response than the current model. Adequate Precision founds the signal-to-noise ratio. A ratio greater than 4 is desirable and the obtained values for the responses 25.694, and 6.393 for Retention Time and Asymmetry respectively specify an adequate signal and these models can be used to navigate the design space.
| ANOVA for Response Surface Linear model | ||||||
|---|---|---|---|---|---|---|
| Analysis of variance table [Partial sum of squares - Type III] | ||||||
| Source | Sum of squares | degree of freedom | Mean square | F value | p-value | Inference |
| Model | 3.13 | 5 | 1.01 | 67.13 | <0.0001 | Significant |
| A-OP | 2.80 | 1 | 2.80 | 183.91 | <0.0001 | Significant |
| B-FR | 0.0836 | 1 | 0.0837 | 5.51 | 0.031 | Significant |
| C-OM | 0.2403 | 1 | 0.2403 | 15.89 | 0.001 | Significant |
| Residual | 0.1961 | 11 | 0.0153 | |||
Table 5: ANOVA table for Retention Time using Box-Behnken design
| ANOVA for Response Surface Linear model | ||||||
|---|---|---|---|---|---|---|
| Analysis of variance table [Partial sum of squares - Type III] | ||||||
| Source | Sum of squares | degree of freedom | Mean square | F value | p-value | Inference |
| Model | 2.456E+05 | 3 | 8.186E+06 | 2.59 | 0.095 | Not Significant |
| A-OP | 1.941E+07 | 1 | 1.941E+07 | 6.17 | 0.023 | Significant |
| B-FR | 2.785E+06 | 1 | 2.785E+06 | 0.8870 | 0.361 | |
| C-OM | 2.357E+05 | 1 | 2.353E+06 | 0.7501 | 0 .401 | |
| Residual | 4.083E+07 | 13 | 3.140E+06 | |||
Table 6: ANOVA table for Theoretical Plate using Box-Behnken design
Figure 3: 2D Contour plots of retention time as a function of % organic composition in mobile phase and flow rate
Figure 4: 2D Contour plots of theoretical plates as a function of % organic composition in mobile phase and flow rate
| ANOVA for Response Surface Linear model | ||||||
|---|---|---|---|---|---|---|
| Analysis of variance table [Partial sum of squares - Type III] | ||||||
| Source | Sum of squares | degree of freedom | Mean square | F value | p-value | Inference |
| Model | 0.7031 | 9 | 0.0783 | 5.31 | 0.019 | Significant |
| A-OP | 0.0701 | 1 | 0.0701 | 4.78 | 0.061 | |
| B-FR | 0.0251 | 1 | 0.0251 | 1.75 | 0.223 | |
| C-OM | 0.0363 | 1 | 0.0363 | 2.51 | 0.153 | |
| AB | 0.0890 | 1 | 0.0890 | 6.21 | 0.040 | |
| AC | 0.0759 | 1 | 0.0759 | 5.29 | 0.054 | |
| BC | 0.0651 | 1 | 0.0651 | 4.50 | 0.070 | |
| A2 | 0.0531 | 1 | 0.0531 | 3.71 | 0.095 | |
| B2 | 0.2681 | 1 | 0.2681 | 0.0657 | 0.803 | Significant |
| C2 | 0.0007 | 1 | 0.0007 | 18.90 | 0.001 | |
| Residual | 0.1008 | 7 | 0.0134 | |||
Table 7: ANOVA table for Asymmetry using Box-Behnken design
Figure 5: 2D Contour plots of asymmetry as a function of % organic composition in mobile phase and flow rate
Design validation
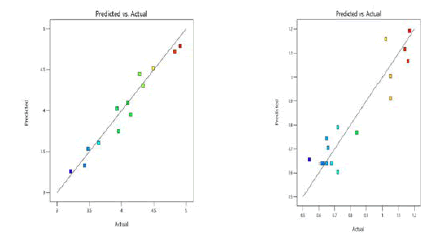
From the predicted versus actual plots of retention time and asymmetry given in Figure 6, it was detected that the selected models for the respective responses were fit for the selected design as this plot specifies the uniform distribution of the data points around the 45° line. It was further proved from the ANOVA Tables 4 and 6 that the selected models were significant with P<0.05 and apt for the design employed in this work.
Figure 6: Predicted versus actual plots of Retention Time and Asymmetry
Optimization by desirability functions approach
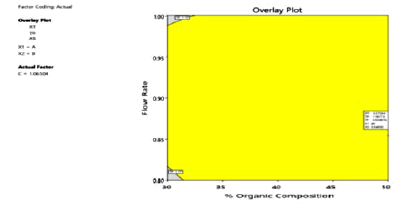
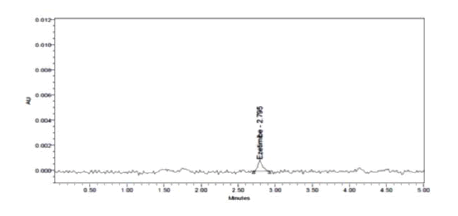
The optimized chromatographic conditions designated based on the desirability functions approach were mobile phase comprising of Acetonitrile: 0.02 N OPA (47:53 v/v) pumped at a flow rate 0.96 ml/min of gave the highest desirability of 0.900. The overlay contour plot shown in Figure 7 denotes the optimized combination of the three selected independent factors which gives the maximum desirability. To check this optimum set of conditions, three replicate injections of 100 μg/ml Ezetimibe were analyzed to determine if their observed responses were within the predicted range as shown in Table 8 and the corresponding optimized chromatogram was shown in Figure 8.
Figure 7: Overlay contour plot supported by responses
Figure 8: Chromatogram of the optimized method
| S. No. | Response variables | Predicted value | Actual value | Desirable range |
|---|---|---|---|---|
| 1 | Retention time (min) | 2.879 | 2.795 | 2.49436–3.96364 |
| 2 | Theoretical plates | 7921.66 | 8345 | 5203.18–6423 |
| 3 | Asymmetry | 1.01 | 1.04 | 0.9-1.2 |
Table 8: Responses of the optimized method
Optimized chromatographic conditions suggested by DOE
Column: Phenomenex C18 (250 mm × 4.6 mm, 5 μm)
Mobile phase: 0.02 N OPA: Acetonitrile (53:47%)
Flow rate: 0.96 ml/min
Wavelength: PDA-UV detection at 232.6 nm
Column temperature: Ambient
Run time: 5 minutes
Method validation
The developed method was linear over the concentration range of 1.25 μg/ml-7.5 μg/ml with a correlation coefficient of 0.999. For the accuracy studies at 50%, 100% and 150% levels the recovery percentage of the drug was found to be within 98.42%-101.11%. System precision, Intermediate precision, and repeatability were carried out and the percent of RSD values were found to be less than 2%. LOD and LOQ values were found to be 0.02 μg/ml and 0.06 μg/ml. The robustness of the developed method was checked by making minor changes in the experimental conditions like flow rate, Percentage of organic composition, and Percent of RSD values for the peak area were found to be less than 2%. From the system suitability tests, the number of theoretical plates was found to be more than 2000 and the tailing factor was found to be less than 2. The summary of the method validation parameters was shown in Table 9 Forced degradation studies of Ezetimibe was performed in various conditions like acidic, basic, peroxide, thermal, photolytic, hydrolytic and reductive. Data of forced degradation studies were presented in Table 10.
| S No. | Parameters | Results |
|---|---|---|
| 1 | Linearity | |
| Linearity range (µg/ml) | 1.25-7.5 | |
| Correlation coefficient | 0.999 | |
| Regression equation | y=43904.x+1683.5 | |
| 2 | Accuracy (% recovery) | |
| 50%, 100%, 150% levels | Between 98.42 and 101.11 | |
| 3 | Precision (% RSD of peak area) | |
| System precision | 1.2 | |
| Repeatability | 1.2 | |
| Intermediate precision | 1.4 | |
| 4 | Sensitivity | |
| LOD (µg/ml) | 0.02 | |
| LOQ (µg/ml) | 0.06 | |
| 5 | Robustness (% RSD of peak area) | |
| Flow rate (± 0.1 ml/min) | 1.2 | |
| Organic phase (± 10%) | 0.45 | |
| Temperature (± 5ºC) | 1.35 | |
| 6 | System suitability | |
| Retention time (min) | 2.795 | |
| Tailing factor | 1.21 | |
| Plate count | 8345 | |
Table 9: Results of the validation parameters
| Drug | Degradation Condition | % Recover | % Drug Degraded |
|---|---|---|---|
| Ezetimibe | Acid | 94.27 | 5.73 |
| Alkali | 95.12 | 4.88 | |
| Oxidation | 94.36 | 5.64 | |
| Thermal | 96.86 | 3.14 | |
| UV | 98.17 | 1.83 | |
| Water | 99.16 | 0.84 |
Table 10: Results of forced degradation studies
Conclusion
A simple, precise, robust, and accurate RP-HPLC method was created for the estimation of Ezetimibe by using the Design of Experiments approach. Box-Behnken Design with three factors of three levels was chosen as the optimization design for the present study. The critical method parameters selected for optimization were percentage of organic content in the mobile phase, organic modifier, and flow rate. The critical quality attributes are retention time, theoretical plates, and Asymmetry. Optimized chromatographic conditions advised by the desirability functions approach comprised of mobile phase 0.02 N OPA (53%): Acetonitrile (47%), which is pumped at a flow rate of 0.96 ml/min gave the highest desirability of 0.9. The retention time of the drug was found to be 2.795 min. Theoretical plates and Asymmetry was within the limits. The validation of the developed method was done as per ICH Q2 (R1) guidelines. The application of RSM offers a better perception of method development and robustness testing. In various stress conditions, degradation studies were also performed.
Acknowledgement
The authors are grateful to Spectrum Pharma Research Solutions., Hyderabad for providing gift samples, and the authors are also obliged to V. V. Institute of Pharmaceutical Science, Gudlavalleru for providing the necessary facilities to carry out the research work
References
- M. V. Heek, H. Davis, Pharmacology of Ezetimibe, Eurn Hrt J Splmnts, 4 (2002), J5–J8.
[Crossref] [Google Scholar] [PubMed]
- B. Shailendra Patel, Ezetimibe: A novel cholesterol-lowering agent that highlights novel physiologic pathways, Currn Card Rprts, 6(2004), 439-442.
[Crossref] [Google Scholar] [PubMed]
- K. S. Prabhat, K. B. Pawan, K. S. Sushant, J. Deepti, Validated RP- HPLC method for estimation of Ezetimibe in different tablet dosage form, Int J Pharm Sci, 1(2009), 174-181.
[Crossref] [Google Scholar] [PubMed]
- P. Kumar, Y. Ahmad, G. Amitav, A stability indicating RP-HPLC method development for determination of Ezetimibe in tablet dosage form, Der Pharma Chemica, 4(2012), 1296-1304.
[Crossref] [Google Scholar] [PubMed]
- P. Ghanshyam, S. Ragvendra, S. Gautham, D. Dinesh, Development and validation of a new reversed-phase HPLC method for the determination of Ezetimibe in pharmaceutical dosage forms, Indn J Pharm Edu and Res, 47(2013), 7-12.
[Crossref] [Google Scholar] [PubMed]
- T. A. Wani, A. Ahmad, S. Zargar, N. Y. Khalil, I. A. Darwish, Use of response surface methodology for development of new micro well-based spectrophotometric method for determination of atrovastatin calcium in tablets, Chem Cen J, 6 (2012), 134.
[Crossref] [Google Scholar] [PubMed]
- M. Deepa, K. Ravindra Reddy, S. V. Satyanarayana, A review on quality by design approach for analytical method development, J Pharm Res, 11 (2017), 272-77.
[Crossref] [Google Scholar] [PubMed]
- ICH Harmonised Tripartite Guideline: Validation of Analytical Procedures: Text and Methodology Q2 (R1), Current STEP 4 Version. Geneva: International Conference on Harmonisation; 2005.
- M. Blessy, D. R. Patel, N. P. Prajapati, Y. K. Agarwal, Development of forced degradation and stability indicating studies of drugs-a review, J Pharm Anlys, 4 (2014), 159-65.
[Crossref] [Google Scholar] [PubMed]
- M. Deepa, K. Ravindra Reddy, S. V. Satyanarayana, A review on quality by design approach for analytical method development, J Pharm Res, 11(2017), 272-77.
[Crossref] [Google Scholar] [PubMed]
- G. E. P. Box, D. W. Behnken, Some new 3 level designs for the study of quantitative variables, J Technometrics, 2(1960), 455-75.
[Crossref] [Google Scholar] [PubMed]
Copyright: © 2022 Sai Datri, et al. This is an open access article distributed under the terms of the Creative Commons Attribution License, which permits unrestricted use, distribution, and reproduction in any medium, provided the original work is properly cited.

